View the Debug Log for a Deployment
Debug logs are captured for interview sessions created by Web Determinations interviews, Determinations Server interview service, and the Chat API. (Note that debug logging is not available for flow deployments.) These logs provide detailed information about what is happening when data is run through an interview and can be used to help you resolve issues when unexpected behavior occurs. Deployment session debug logging is available through the Intelligent Advisor Hub user interface (see below), as well as by using the Deployments REST API.
After debug logging has been enabled, the debug log for a deployment can be accessed in Intelligent Advisor Hub by a Manager as follows:
- In Intelligent Advisor Hub, navigate to the Deployments Page.
- Click the deployment name. The deployment details page is displayed.
- Click the Actions menu and select View debug log. The Debug log page for that deployment is displayed.
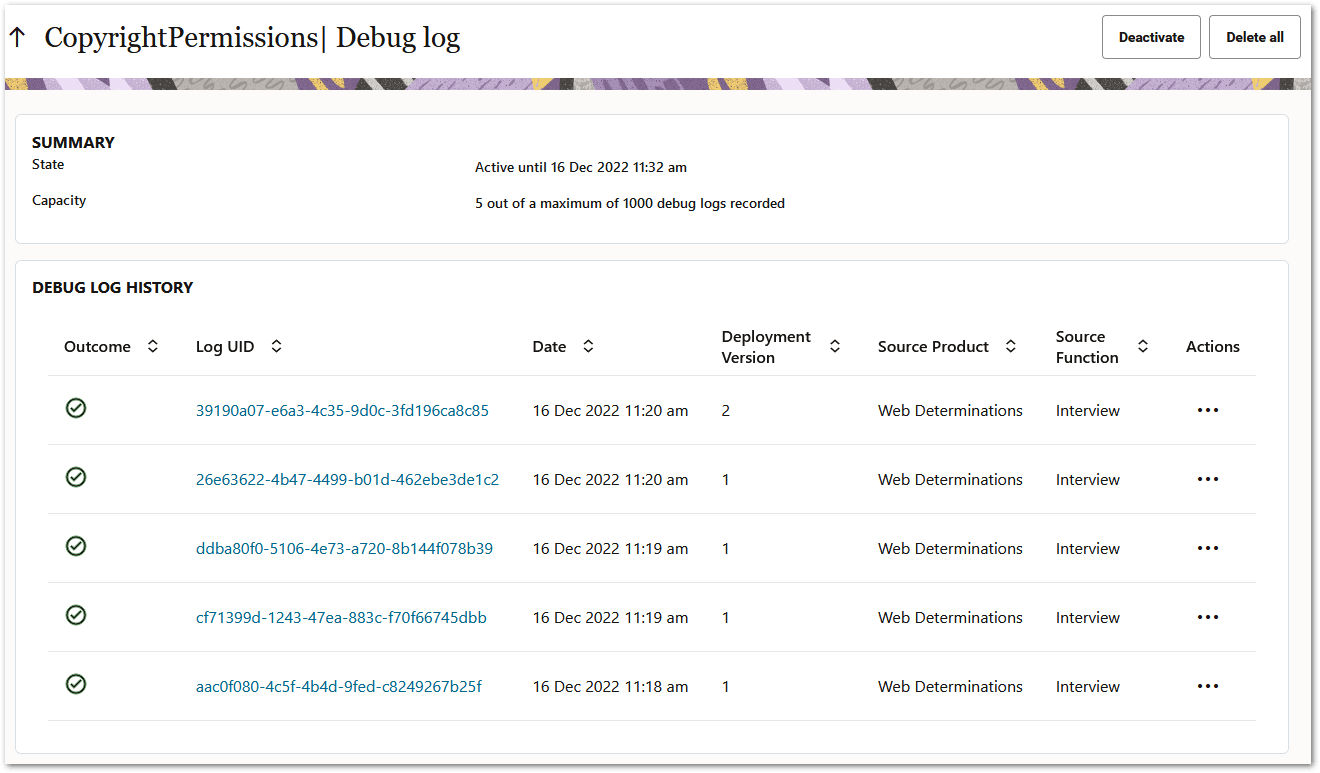
On the Debug log page, the SUMMARY panel displays:
-
The current state of debug logging for the deployment. This is either:
-
Inactive: Debug logging has not been activated, or has been manually deactivated by a user.
-
Active: Debug logging is currently active.
-
Expired: Debug logging has been stopped because the activation period has expired.
-
Terminated: Debug logging has been stopped by the system because the debug log has reached capacity.
-
-
The current capacity of the deployment debug log:
-
The number of debug logs recorded.
-
The maximum number of debug logs that can be recorded. If the maximum number of debug logs are currently stored for a deployment, the system will automatically terminate debug logging for the deployment. For more information, see Automatic data capping.
-
The DEBUG LOG HISTORY panel displays a table where each row represents an individual debug log. Column values for each debug log will show:
-
Outcome: The state of the debug log. A green tick indicates ok. A red warning triangle indicates an error.
-
Log UID: The generated unique identifier for the debug log. You can click on the Log UID to access the debug events page. For more information, see View the debug events for a particular debug log.
-
Date: The date and time that the debug log record was created.
-
Deployment Version: The deployment version that was active when the debug log was created.
-
Source Product: The source product that created the debug log (that is, Web Determinations orDeterminations Server Interview Service).
-
Source Function: The source function that created the debug log (that is, Interview).
-
Actions: A menu of operations that can be applied to the debug log. The options are:
-
Download - For more information, see Download the debug log.
-
Delete - For more information, see Delete a Debug Log for a Deployment.
-
View the debug events for a particular debug log
On the Debug log page you can click the Log UID to access the debug events for that particular log.

On the events page, each row represents a debug event recorded for the selected debug log.
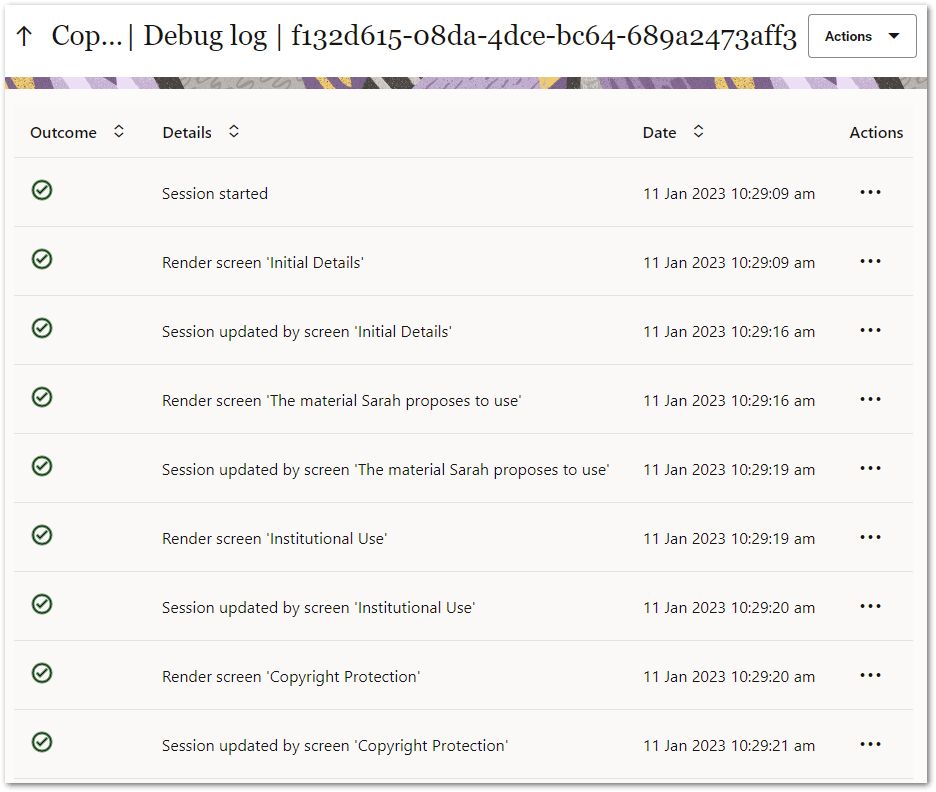
Column values for each debug event will show:
-
Outcome: The state of the debug event. A green tick indicates ok. A red warning triangle indicates an error.
-
Details: The description of the event. Full details of the event, including the payloads sent and received for HTTP requests and responses, can be accessed by downloading the individual event or downloading the entire log.
-
Date: The date and time that the debug event was recorded.
-
Actions: A menu of operations that can be applied to the debug event. The options are:
-
Download event - For more information, see Download a debug event.
-
Automatic data capping
Debug logging will be capped to a maximum number of debug log records for each deployment. This limit is a configurable property for self-managed Intelligent Advisor users (debug_log_auto_purge_retain_max_count). For more information, see Intelligent Advisor Hub Configuration Properties. Cloud Service users should contact Oracle Cloud support if they need to increase the maximum number of debug logs.
Automatic purging of expired data
A background maintenance task will be run periodically by the system to automatically identify and delete expired debug logs from the database. The maximum number of hours a debug log record can remain in the database before being considered expired is controlled by a configuration property debug_log_auto_purge_retain_max_hours
The background maintenance task will be executed using the existing maintenance task framework and schedule. When executed, the task will delete the oldest hour of debug log data that is older than the number of hours identified by the configuration property.
The size of the chunks deleted by the automatic data purging task is also controlled by a configuration property debug_log_auto_purge_max_logs_per_trx. It can be decreased if the deletion process is taking too long and blocking other functions, or increased if the system can handle it.
These configuration properties can be changed by self-managed Intelligent Advisor users. For more information, see Intelligent Advisor Hub Configuration Properties. Cloud Service users should contact Oracle Cloud support if they need to change these settings.