View Asset Details

View details about an asset, including its state, metadata, images, actions, any current incidents, sensor behavior, and location history.

  1. In the Operations Center for your organization, click Assets Assets icon.
  2. Use the breadcrumbs to navigate to the appropriate group if your asset appears in a group.
    You can use the Filter Filter icon to search for individual assets based on asset attributes such as name, description, location, and type.

    You can also filter the assets in your view based on custom asset attributes set by your organization. For example, if your assets use attributes such as manufacturer name, model number, and warranty status, you can look for assets using the manufacturer, model, or warranty status value.

  3. Click Show Details (Show Details icon) against the appropriate asset row.
    The Digital Twin view for the asset appears. If the asset has sensor attributes, the values of those sensor attributes are displayed. If the asset has associated assets, the sensor values from associated assets also appears.
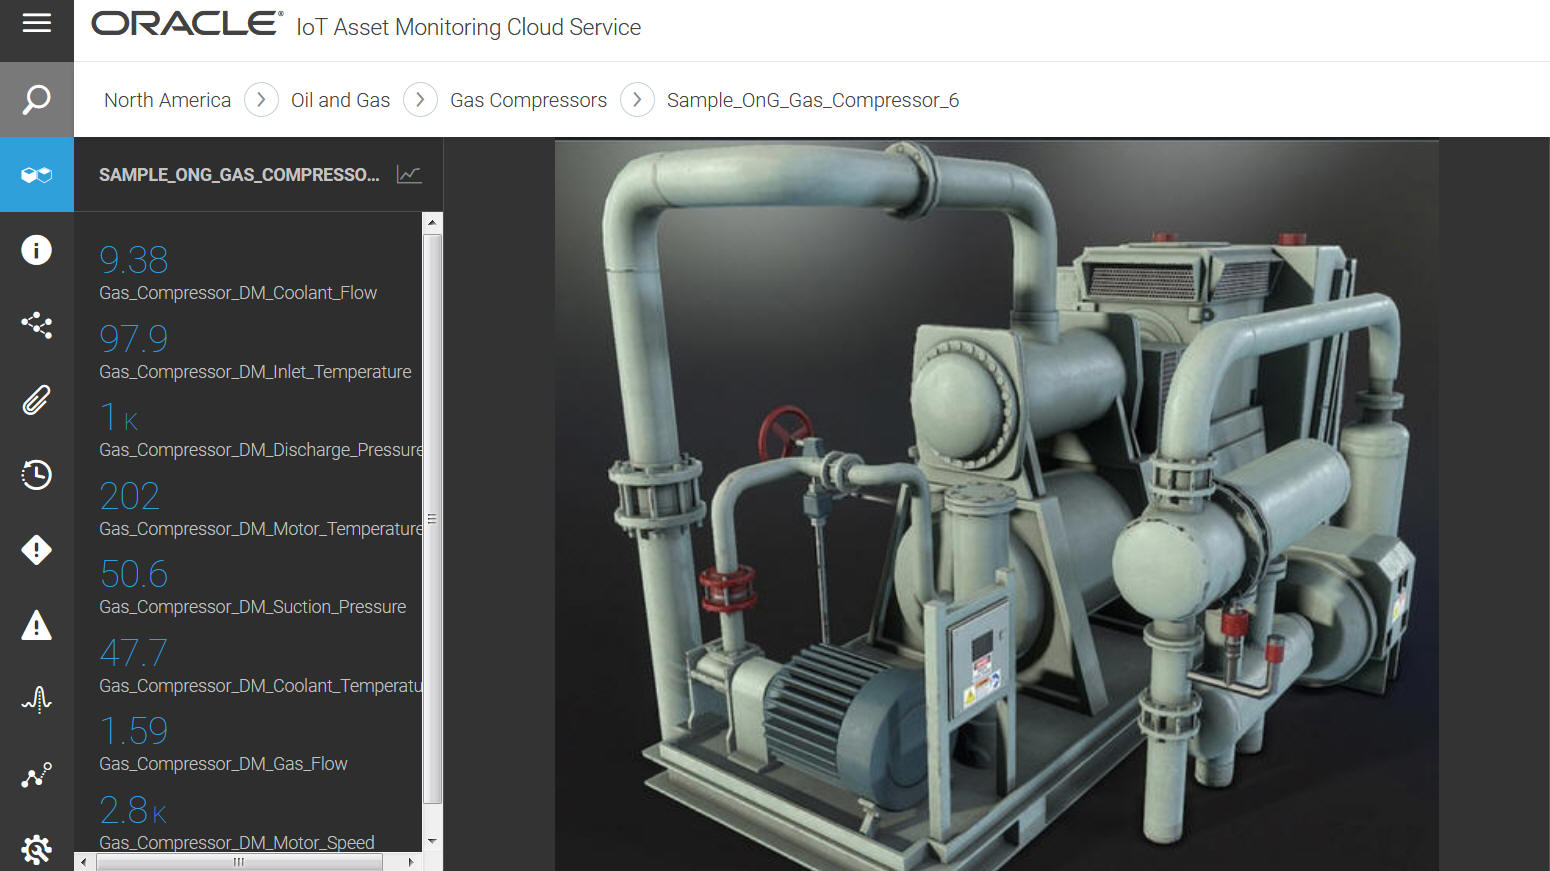
    The following image shows the digital twin version of a gas compressor asset along with its sensor attributes:


    Sensor attributes in asset digital twin

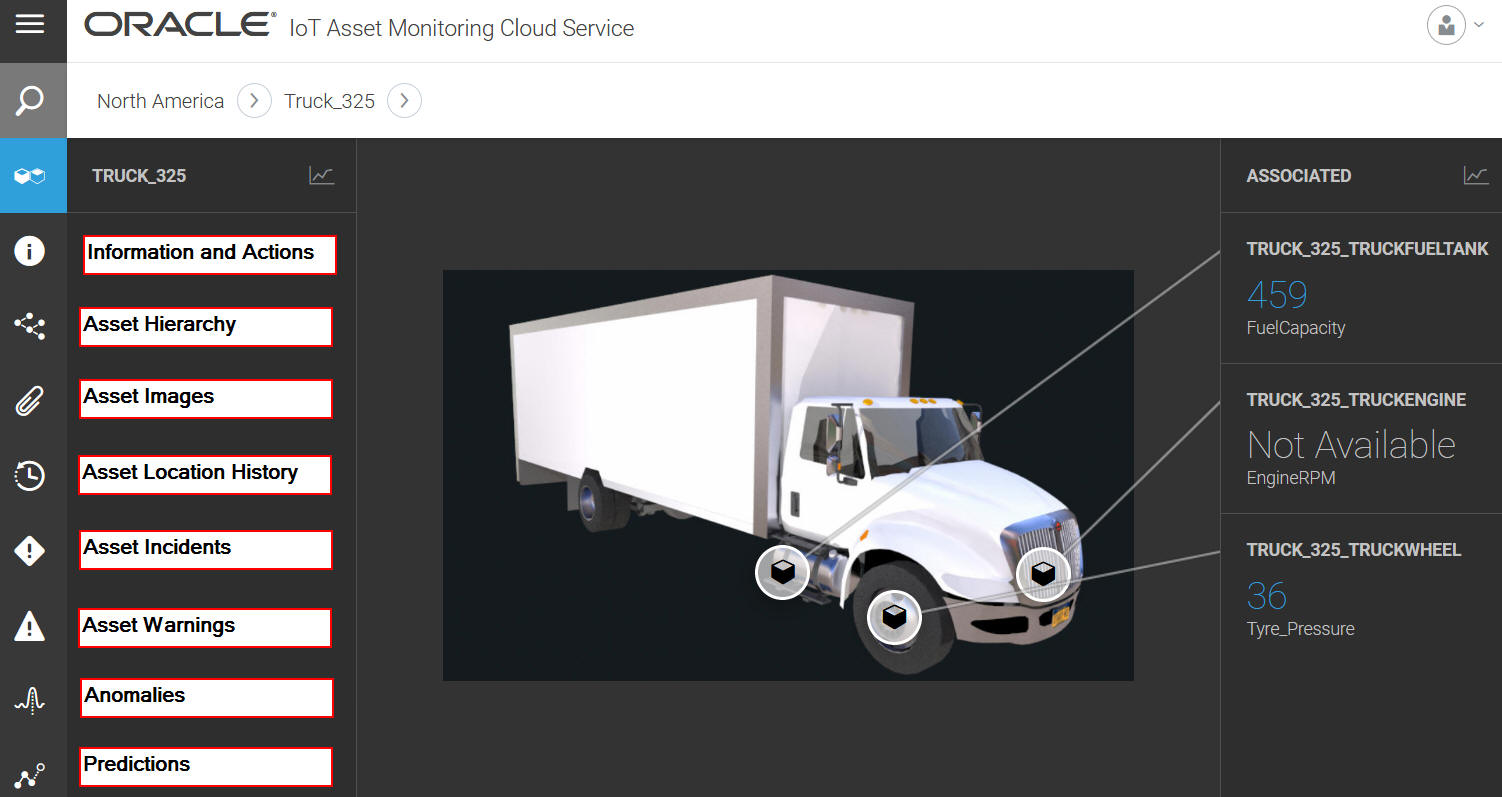
    The following image shows a truck asset with associated sub-assets, namely, fuel tank, engine, and wheel:


    Asset Details Page Described in Text

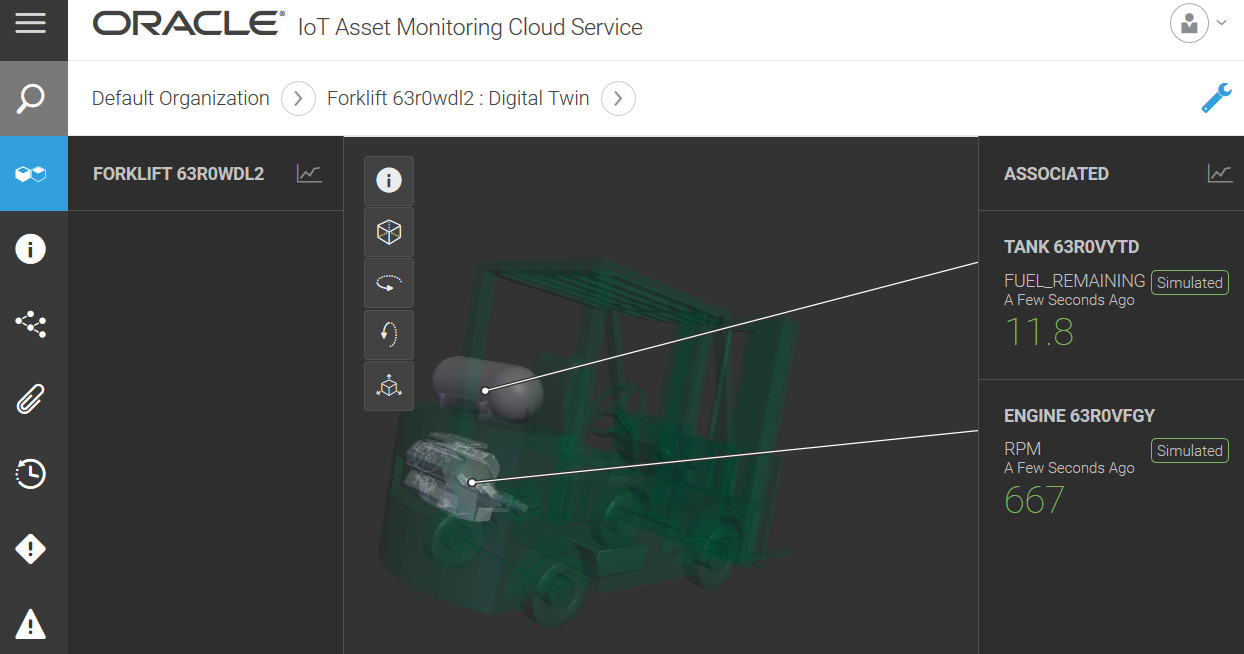
    If your asset uses a 3D model, then the 3D model appears along with the associated viewing tools. The following image shows the digital twin for a forklift asset.


    3D Model of a Forklift Digital Twin

    The following tools are available:
    • Explode Explode Asset Icon: You can also choose to explode the model, so that the sub-components separate out to varying degrees. Use the slider tool to choose the degree of separation.
    • Rendering Style Rendering Style Icon: Choose between the available styles, such as Wireframe, Shaded, and X-Ray.
    • Rotate Right Rotate Right Icon: Use to rotate the asset model along the horizontal plane.
    • Rotate Down Rotate Down Icon: Use to rotate the asset model along the vertical plane.
    • Orientation Orientation Icon: Use the pin icon to save the current orientation, so that the same default orientation is used in the digital twin view in Operations Center. The reset icon switches back the orientation to the last pinned one.
  4. Select a sensor attribute to show the data plot for the sensor attribute.
    You can choose to view live sensor data or select a different time period. The following options are available:
    • Live
    • Last 1 Hour
    • Last 24 Hours
    • Last 7 Days
    • Last 30 Days
    • Custom: Lets you select a custom time period from the calendar.
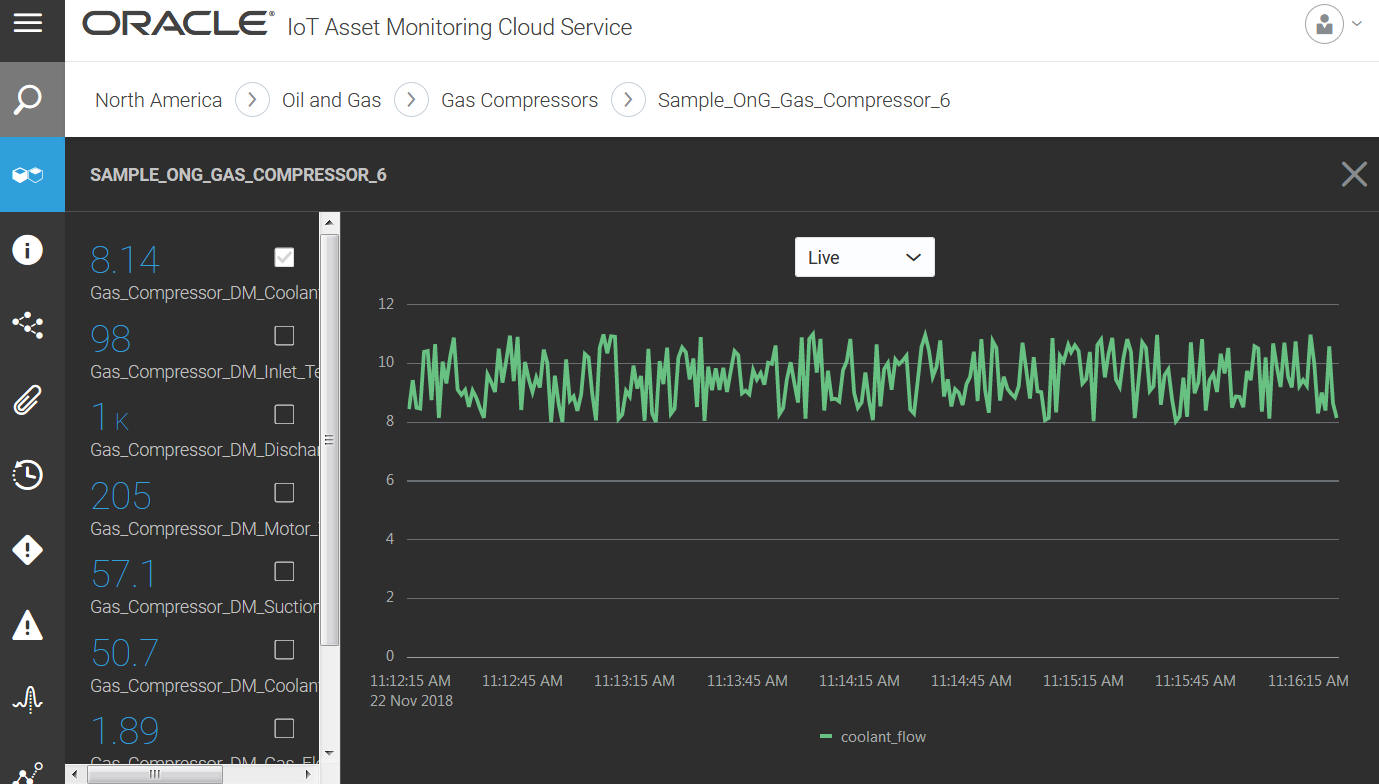
    The following image shows the live sensor plot for coolant flow data from a gas compressor asset:


    Live sensor plot for coolant flow data

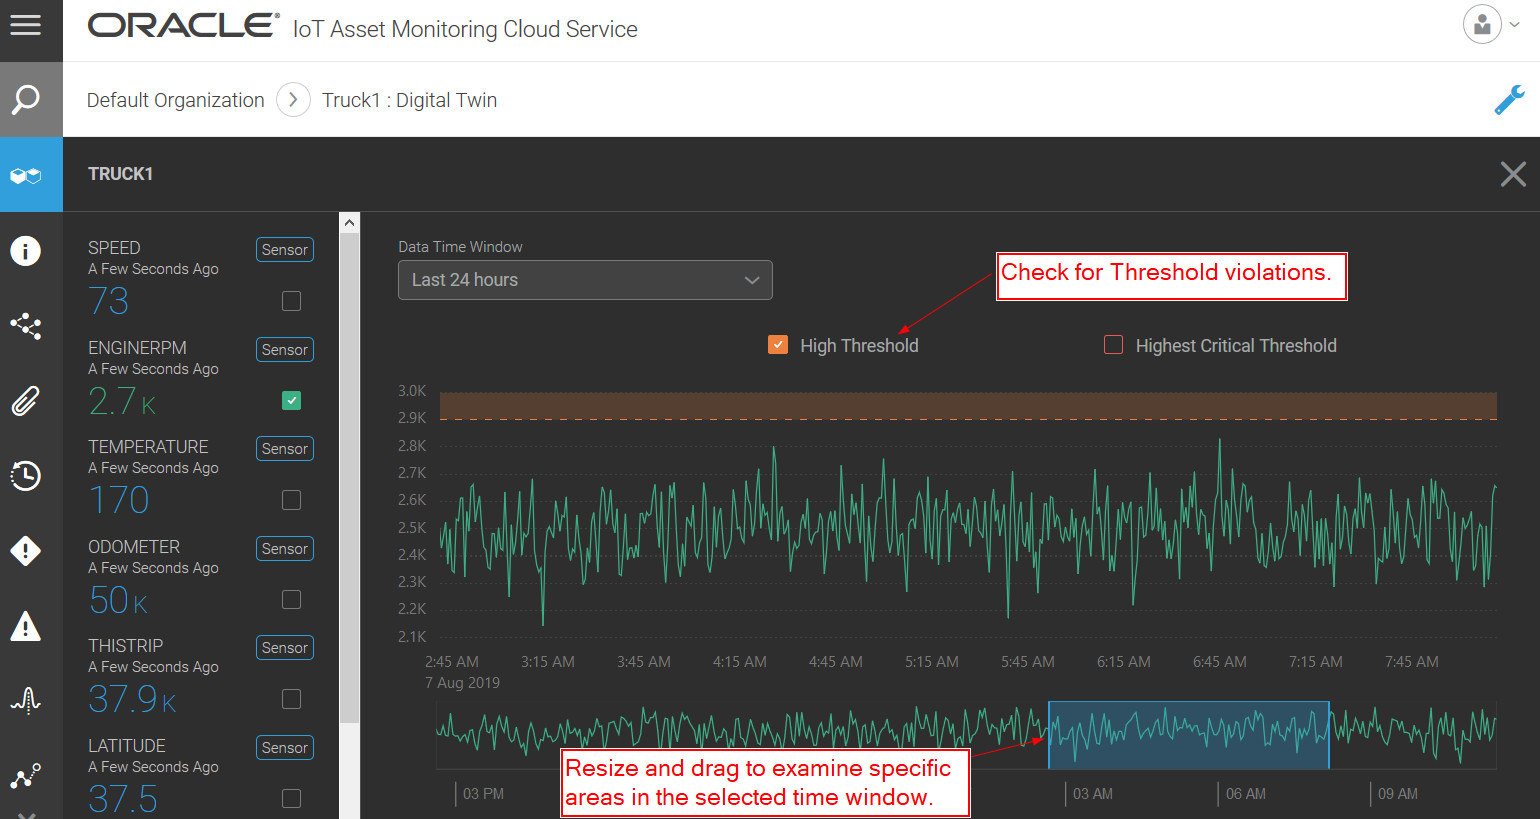
    If you have defined high and low threshold values for your sensor attribute, you can choose to display these bars against the plot, so that you can examine threshold violations, if any.

    You can choose to re-size and drag the highlighter on the time line to examine a specific portion of the plot more closely.

    The following image shows a sensor attribute with upper threshold values and time line highlight:


    Sensor attribute plot settings: Described in text

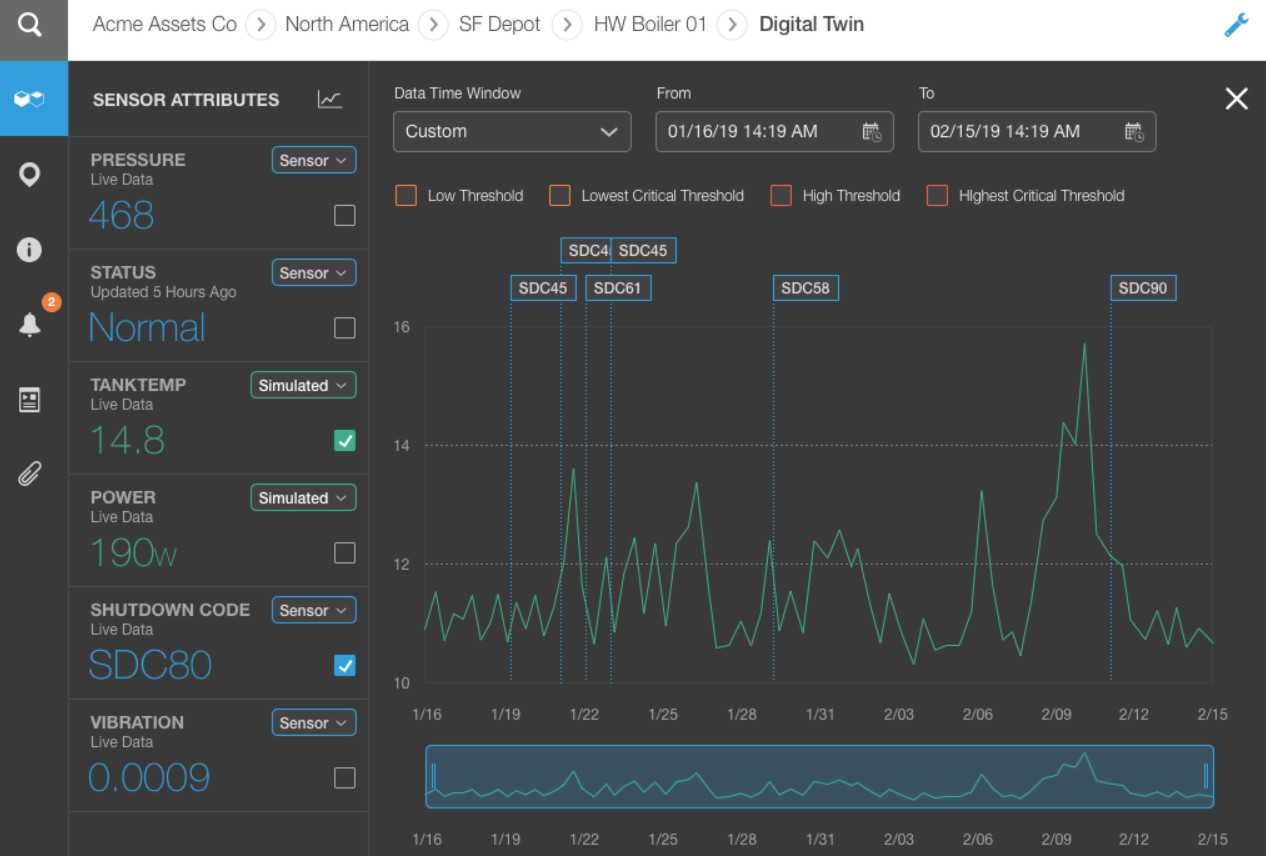
    You can also select multiple sensor attributes to compare or correlate them. The following example selects the tank temperature sensor attribute. It also selects the shutdown code attribute to investigate possible correlation between temperature spikes and shutdown events.


    Correlating Attributes

    Note that string attribute values can also be displayed on the data plot.
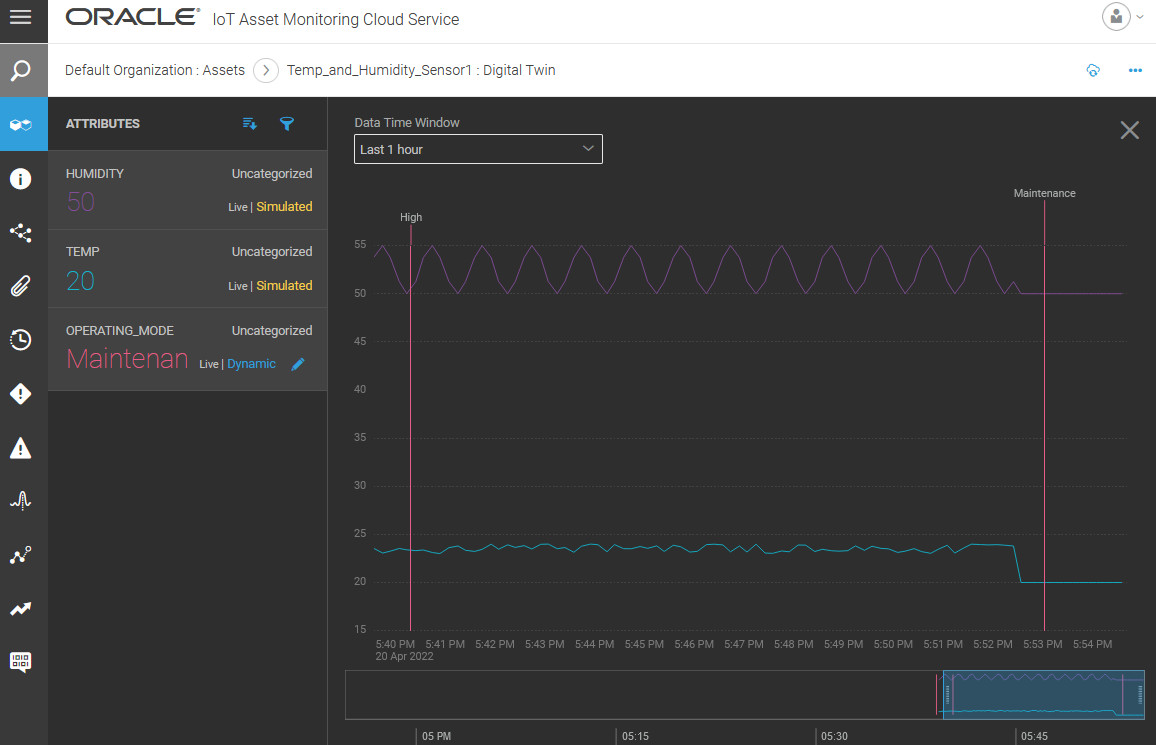
    The following image shows a dynamic attribute plotted along with sensor attributes. Notice that you can edit the dynamic attribute value in Operations Center. For example, the operating mode value in the following chart changes from High to Maintenance.
    Sensor attributes and dynamic attribute: Described in text

  5. Use the menu bar on the left to navigate to various views:
    • Search: Lets you search for other assets, groups, locations and places.
    • Digital Twin: Shows the digital twin version of the asset along with its current sensor attribute values along with the sensor attribute values of all associated sub-assets.
    • Info: Shows all standard attribute information and actions available for the asset. You can also use the Info page to trigger actions for the asset device.
    • Hierarchy: Shows the asset hierarchy diagram with the asset and its sub-assets (if any).
    • Asset Images: Shows the images associated with the asset.
    • Location History: Shows the location of the asset over the past few hours or days. You can choose the time period for which you wish to see the location history.
    • Incidents: Shows the list of incident reports generated for the asset. Open incidents are flagged separately. You must have previously configured rules to generate incidents.
    • Warnings: Shows the list of warning logs generated for the asset. You must have previously configured rules to generate warnings.
    • Anomalies: Shows the anomalies detected for the asset. You must have previously configured anomalies for the asset type.
    • Predictions: Shows the predictions for the asset. You must have previously configured predictions for the asset type.
    • Trends: Shows the trends for the asset sensor attributes and metrics. You must have previously configured trends for the asset type.
    • Any Custom Dashboards: Dashboards created for an asset type are available for each asset of the corresponding type. The icon shown depends on the icon you chose for the dashboard.
  6. Use the breadcrumbs to navigate back to the Operations Center view for the organization or group.

Sort and Filter Sensor Attributes

The Digital Twin view includes adaptive views and capabilities to filter and sort the sensor attributes for your assets and associated child entities.

The sensor attributes for your assets and associated entities appear category wise, by default. You can change the sort order to arrange attributes by name, or have the attributes with the latest updates appear on top. You can also filter the attributes list based on the attribute name or category.
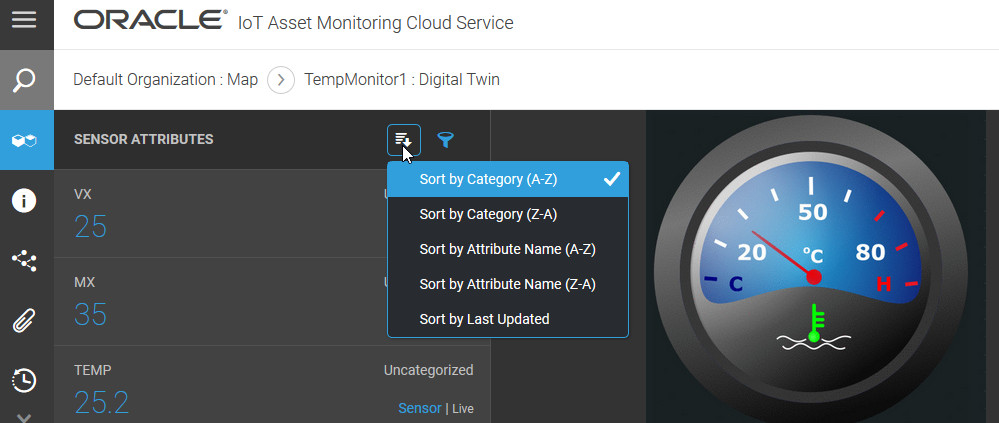

Operations Center: Sort and Filter Sensors for an Asset (Described in Text)

If you have a large number of associated entities for an asset, say fifty or more, then the Digital Twin view automatically creates an additional column for the associated entities. You can conveniently select an associated entity from the column to view its sensor attributes in a separate column.

Change Live Refresh Options for Your Sensor Attributes

You can disable or re-enable automatic refresh for the sensor attribute values of your assets in the Digital Twin view. When enabled, you can choose the refresh frequency.

You can select refresh intervals between 10 seconds and 5 minutes. Use the Digital Twin menu to set the live refresh options.
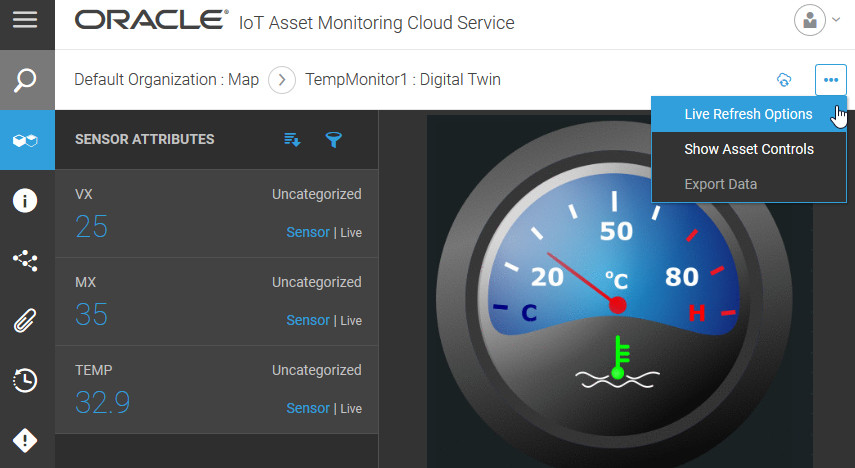
Digital Twin Menu: Live Refresh