9 Manage and Monitor Custom Dashboards

Create and use dashboards to track key metrics pertaining to your business processes. You can also use custom dashboards to view historical values for your metrics and gain statistical data for measuring your business efficiency.

In addition to the in-built Organization Dashboard, you can create and manage:
  • custom dashboards that display status and information about the trips and shipments of an organization.

  • custom dasboards that display key metrics for vehicles and drivers.

Manage and Monitor Custom Dashboards for Organizations

The Organization Dashboard provides you the status of the en-route trips and typically highlights the exceptions and deviations raised in them. To monitor all other trips of an organization, such as completed or planned trips, create one or more custom dashboards, and view them from the Operation Center. Manage the custom dashboards by adding or removing metrics, incidents, alerts, and other attributes of any entity of an organization.

Create and View a Custom Dashboard

Create a custom dashboard from the Organization option of the Design Center and view it in the Operation Center of the Organization.

Sign in as an administrator and ensure that you have switched to the organization for which you need to create a custom dashboard.
  1. Click Menu Menu icon and then Design Center.
  2. From the Design Center, click Organization.
  3. From the lower section, click Dashboards.
    On the Dashboards page, the Organization Dashboard is listed.
  4. Click Create Dashboard Add icon.
  5. On the Create Dashboard dialog, based on your required layout, select an appropriate template either from the Blank tab or from the Saved tab. Select a template from the available templates and click Create.
    The design page of a new dashboard is displayed, which is based on your selected template.
  6. On the blank dashboard, enter or select the following values:
    • Name: Enter a name for the custom dashboard.
    • Role Access: Add or removes roles which can view this dashboard.
    • Icon: Select an icon for the dashboard, which appears in the Operation Center.
    To add a new metric group or a gadget to the dashboard, see Add or Remove Metrics on Custom Dashboards.
  7. Click Save and then click Close Close icon.
    The custom dashboard appears on the Dashboards list.
  8. To view this custom dashboard, click Menu Menu icon and then Operation Center.
    At the end of the left navigation bar, you can view the icon of your custom dashboard. Click the icon.
The dashboard is displayed, which is blank. To add a new gadget or metrics to the dashboard, see Add or Remove Metrics on Custom Dashboards.

Add or Remove Metrics on Custom Dashboards

Manage your custom dashboard by adding metric groups and then adding gadgets into the groups. Configure each gadget to display a metric vlaue of an entity.

As an administrator, you should have created a custom dashboard in the current organization. See Create and View a Custom Dashboard.
  1. Click Menu Menu icon and then Design Center.
  2. From the Design Center, click Organization.
  3. From the lower section, click Dashboards.
    On the Dashboards page, the custom dashboards are listed below the Oganization Dashboard.
  4. Select the custom dashboard in which you need to add or remove metrics and click Edit Edit icon.
    The dashboard design page is displayed.
  5. To create a group that would display a collection of metric values, click Add Metric Group Add icon.
  6. On the new tile, in the text field, enter a name of the group.
  7. (Optional) To place the box before an existing metric group or in a specific area of the dashboard, on the top right corner of the tile, click the Drag icon, and with the mouse pressed, drag and drop the tile in the desired section of the dashboard.
  8. To add a specifc metric value to an existing metric group, click the Add New GadgetAdd icon icon that appears inside the metric group tile.
  9. On the Create Dashboard Item dialog box, enter or select the following values:
    • Type: Select Metrics.
    • Metric: From a specific entity, such as Drivers, Equipment, Facilities, Vehicles, Shipments, Ship Units, or Ship Items, select the required metric to be displayed.
    • Aggregate: Select the approprite aggregate function such as Average, Max, Min, Sum, or Percentile, if applicable for the metric selected in the previous option.
    • Label: Enter the label text for the metric gadget. The default label uses the name of the metric that you selected.

      The Label can be different from the metric name. For example, if you are aggregating the average delay across shipments, you may use Average Delay to highlight this fact.

    • Unit: (Optional) Enter the unit value if it is enabled for the specific metric.
    • Icon: (Optional) Select the icon that'll appear on the metric gadget.

      The dashboard icon you select is used on the menu bar in the Operations Center.

    • Color: (Optional) Select the color of the label, value, and the icon that appears on the metric gadget.
    • Histogram: Select this checkbox to show a preview chart against the metric gadget icon. This setting is available only if the metric is a global-level KPI (created at the organization level) and is of numeric or boolean type with scheduled data. For any metrics created at the entity level (for example vehicle types or drivers), the Histogram setting is not available.
  10. Click Create.
    A new metric with its value is displayed in the metric group.
  11. To create another metric gadget, repeat Steps 8 through 10.
  12. To create a metric group, complete Steps 5 and 6.
  13. To modify a metric gadget, click the Edit Edit iconicon that appears inside the gadget. Modify the required fields in the Configure Dashboard Item dialog box, and click Update.
  14. To delete a metric gadget, click the Delete Delete iconicon that appears inside the gadget.

Delete a Custom Dashboard

Delete a custom dashboard from the Design Center of an Organization, which will also remove it from the Operation Center.

Sign in as an administrator and ensure that you have switched to the organization for which you need to delete a custom dashboard.
  1. Click Menu Menu icon and then Design Center.
  2. From the Design Center, click Organization.
  3. From the lower section, click Dashboards.
    On the Dashboards page, the custom dashboards are listed including the Oganization Dashboard.
  4. Select the custom dashboard to be deleted and for that dashboard, click Delete Delete icon.
  5. To verify the removal of the custom dashboard, click Menu Menu icon and then Operation Center.
    At the end of the left navigation bar, verify that the icon of your custom dashboard is not listed.

Manage and Monitor Custom Dashboards for Vehicle Types, Drivers, and Trips

Create custom dashboards for vehicle types, drivers, and trips, to visualize your most relevant business metrics in a single pane and use it to track their respective performances. For example, you can create a dashboard for vehicles and then use it to track metrics such as availability status, consumed fuel cost, idling duration, and so on. Manage the custom dashboards by adding or removing metrics, incidents, alerts, and other attributes of vehicle types or drivers.

Create and View Custom Dashboards for Vehicle Types, Drivers, and Trips

Create a custom dashboard from the Vehicle Types, Drivers, or Trips option of the Design Center and view it in the Operation Center of the Organization.

Sign in as an administrator and ensure that you have switched to the organization for which you need to create a custom dashboard.
  1. Click Menu Menu icon and then Design Center.
  2. From the Design Center, depending on whether you want to create a custom dasboard for vehicles, drivers, or trips, click Vehicle Types, Drivers, or Trips, respectively.
  3. From the lower section, click Dashboards.
  4. On the Dashboards page, click Create Dashboard Add icon.
  5. On the Create Dashboard dialog, based on your required layout, select an appropriate template either from the Blank tab or from the Saved tab. Select a template from the available templates and click Create.
    The design page of a new dashboard is displayed, which is based on your selected template.
  6. On the blank dashboard, enter or select the following values:
    • Name: Enter a name for the custom dashboard.
    • Role Access: Add or removes roles which can view this dashboard.
    • Icon: Select an icon for the dashboard, which appears in the Operation Center.
    To add a new metric group or a gadget to the dashboard, see Add or Remove Metrics on Custom Dashboards for Vehicle Types, Drivers, and Trips.
  7. Click Save and then click Close Close icon.
    The custom dashboard appears on the Dashboards list.
  8. To view this custom dashboard, click Menu Menu icon . From the Operation Center menu options, click Vehicles or Drivers, and then click the information icon for a given vehicle or driver.
    At the end of the left navigation bar, you can view the icon of your custom dashboard. Click the icon.
The dashboard is displayed, which is blank. To add a new gadget or metrics to the dashboard, see Add or Remove Metrics on Custom Dashboards for Vehicle Types, Drivers, and Trips.

Add or Remove Metrics on Custom Dashboards for Vehicle Types, Drivers, and Trips

Manage your custom dashboard by adding vehicles, drivers, or trips-specific metric groups and then adding gadgets into the groups. Configure each gadget to display a metric value for vehicles, drivers, or trips.

As an administrator, you should have created a custom dashboard in the current organization. See Create and View Custom Dashboards for Vehicle Types, Drivers, and Trips.
  1. Click Menu Menu icon and then Design Center.
  2. From the Design Center, click Vehicle Types, Drivers, or Trips.
  3. From the lower section, click Dashboards.
    On the Dashboards page, the custom dashboards are listed.
  4. Select the custom dashboard in which you need to add or remove metrics and then click Edit Edit icon.
    The dashboard design page is displayed.
  5. To create a group that would display a collection of metric values, click Add Metric Group Add icon.
  6. On the new tile, in the text field, enter a name of the group.
  7. (Optional) To place the box before an existing metric group or in a specific area of the dashboard, on the top right corner of the tile, click the Drag icon, and with the mouse pressed, drag and drop the tile in the desired section of the dashboard.
  8. To add a specifc metric value to an existing metric group, click the Add New GadgetAdd icon icon that appears inside the metric group tile.
  9. On the Create Dashboard Item dialog box, enter or select the following values:
    • Type: If you are creating a dashboard for Drivers or Trips, then select Metrics. If you are creating a dashboard for Vehicle types, then you can select either Metric or Sensor Attributes.
    • Metric: From a specific entity such as Vehicles or Drivers, select the required metric to be displayed. For example, for Vehicles, you can select metrics such as Alerts, Fuel Consumed, Idling Duration, and so on. Similarly, for Drivers, you can select metrics such as Distance Driven, Driving Speed, Harsh Acceleration, and so on.
    • Sensor Attribute: Select the required sensor attribute to be displayed, for example, EngineRPM. The Sensor Attribute drop-down list is displayed only while creating a Vehicle Type dashboard with the Type field set to Sensor Attributes.
    • Label: Enter the label text that appears for the metric gadget. The default label uses the name of the metric that you selected. The Label can be different from the metric name.
    • Unit: (Optional) Enter the unit value if it is enabled for the specific metric.
    • Icon: (Optional) Select the icon that'll appear on the metric gadget.
    • Color: (Optional) Select the color of the label, value, and the icon that appears on the metric gadget.
    • Histogram: Select this checkbox to show a preview chart against the metric gadget icon. This setting is available only if the metric is created at the entity level (for example vehicle types or drivers) and is of numeric or boolean type with scheduled data. For any global-level KPI (created at the organization level), the Histogram setting is not available.
  10. Click Create.
    A new metric with its value is displayed in the metric group.
  11. To create another metric gadget, repeat Steps 8 through 10.
  12. To create a metric group, complete Steps 5 and 6.
  13. To modify a metric gadget, click the Edit Edit iconicon that appears inside the gadget. Modify the required fields in the Configure Dashboard Item dialog box, and then click Update.
  14. To delete a metric gadget, click the Delete Delete iconicon that appears inside the gadget.

Delete Custom Dashboards for Vehicle Types, Drivers, and Trips

Delete a custom dashboard from the Design Center of an Organization, which will also remove it from the corresponding Vehicles, Drivers, or Trips pages in the Operation Center.

Sign in as an administrator and ensure that you have switched to the organization for which you need to delete a custom dashboard.
  1. Click Menu Menu icon and then Design Center.
  2. From the Design Center, click Vehicle Types, Drivers, or Trips.
  3. From the lower section, click Dashboards.
    On the Dashboards page, the custom dashboards are listed.
  4. Select the custom dashboard to be deleted and for that dashboard, click Delete Delete icon.
  5. To verify the removal of the custom dashboard, click Menu Menu icon. From the Operation Center menu options, click Vehicles, Drivers, or Trips and then click the information icon for a given vehicle, driver, or trip.
    At the end of the left navigation bar, verify that the icon of your custom dashboard is not listed.

View and Compare Metric Data

You can view the metric data in a chart view and compare the historical data for both in-built and custom metrics by navigating from the dashboard widgets. In addition, you can choose upto four metrics for comparison and generate relative performance insights by enabling multiple y-axis chart.

For example, you can create a custom metric calculation to measure the Vehicle Idle Time on a monthly basis. This will give an overview of the fleet utilization and efficiency. You can view and compare the historical values on a monthly basis to understand if you need to procure additional vehicles for your fleet. You can also add other relevant metrics such as fuel economy or fuel consumed to compare the impact of idling on the fuel consumed or the average fuel economy.

You can also view historical metric data (hourly, weekly, or monthly) in both chart and tabular views. Historical views are displayed in the custom dashboard widgets only for metrics for which you select the Histogram checkbox. In the Chart view, you can view historical data for any secondary metrics (selected from the Select Metric drop-down list) capable of having historical data, irrespective of whether you selected the Histogram checkbox for it.
  1. Navigate to and view your custom organization dashboard, vehicle dashboard, or driver dashboard. To do so:
    1. For custom organization dashboard: Click Menu Menu iconand then Operation Center. At the end of the left navigation bar, you can view the icon of your custom dashboard. Click the icon.
    2. For custom dashboards for vehicles or drivers: Click Menu Menu icon. Then, from the Operation Center menu options, click Vehicles or Drivers, and then click the information icon for a given vehicle or driver. At the end of the left navigation bar, you can view the icon of your custom dashboard. Click the icon.
  2. In the dashboard view, click the metric whose data you want to view.
    A chart view for the metric is displayed.
  3. To view historical data for the metric for a specific time period, select the relevant time duration from the Data Time Window drop-down list. Note that if you select Custom time duration, then you can specify a time period in the last six months.
  4. To compare the historical data of one or more metrics, in the Metric Comparison section of the Chart view, choose the metrics from the Select Metric drop-down list. In addition, you can select the Multiple Y Axis checkbox for an alternative visualization option of the selected metrics. You can compare data for upto four metrics.

    Note:

    If you select a metric without historical data, then a warning icon next to the metric is displayed.
  5. To view metric data in tabular format, click List List icon.
  6. To switch back to chart view, click Chart Chart icon.

Export Metric Data

Export your metric data from the tabular view to a comma-separated value (CSV) file.

  1. Navigate to and view your custom organization dashboard, vehicle dashboard, or driver dashboard.
  2. In the dashboard view, click the metric data that you want to export.
    A chart view for the metric is displayed.
  3. From the Data Time Window drop-down list, select the time period for which you want to export data.

    Note:

    Currently, you can export metric data only for the primary metric that you selected. You cannot export data for any other secondary metrics that you have might selected from the Select Metric drop-down list.
  4. Click List List icon to switch to viewing data in a tabular format.
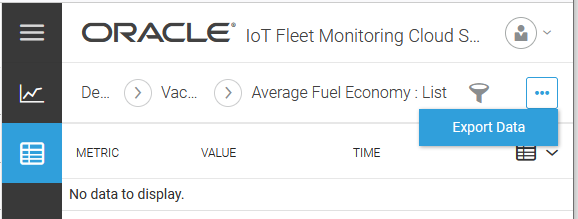
  5. Select Export Data from the Actions menu on the upper-right side of the page.

    Export Data option

  6. Browse to a location to save the file and then click Save.