To monitor trips and its sub-entities including its vehicle, driver, equipment, ship-units, and ship-items, use the menu options in the operation center.
As a fleet manager you can monitor a trip and its entities in real-time by viewing their summarized data as lists, snapshot view in charts, detailed data of individual entities in the information view, analyzed data on dashboards, route, stops, and ETA related data on map views. You can also manage and monitor the incidents, alerts, and exceptions raised during a specific trip.
In this chapter, you see how to monitor those trips and their sub entities including ship-order, equipment, ship-units, and ship-items, that got imported from an external application such as Oracle Transportation Management Cloud.
To monitor or view a vehicle from the operation center, see View Your Vehicles in the Operations Centerand to view a driver from the operation center, see View Driver Details
Monitor the Trip Dashboard
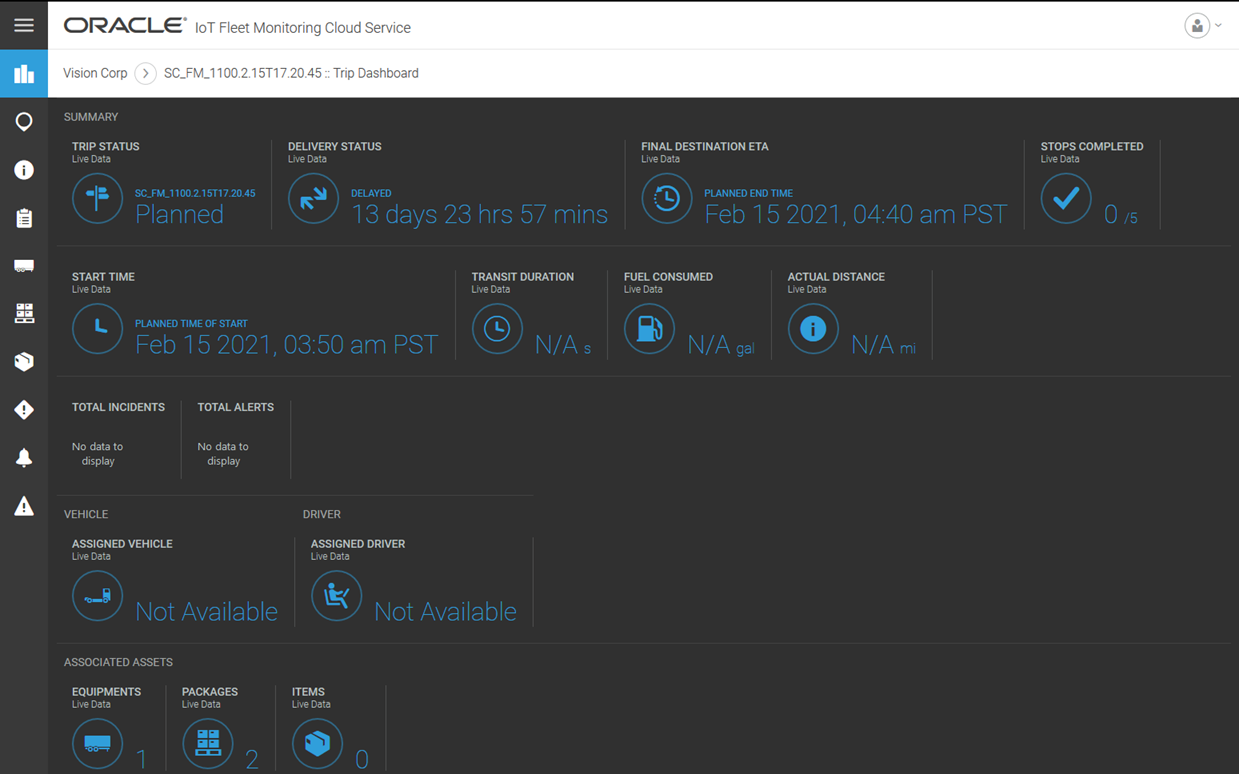
Trip dashboard gives you a snapshot of a trip through widgets and icons that display the status including live data on expected ETA at final destination, start time, delivery status, stops completed, distance covered, fuel consumed, number of incidents and alerts raised, and the status of all its sub entities.
As an administrator, you can view the trip dashboard to obtain the real-time status summary of a specific trip. You should ideally know the name of the trip in the current organization that you wish to monitor. You should be on the Operation Center.
- From the Operation Center menu options, click Trips
 .
.The trips summary view is displayed that lists all the trips of the current organization.
- From the list of trips, identify the trip name that you wish to monitor. Scroll to the last column of the record, hover your mouse, and click Information
 .
.The map view of the trip is displayed and a menu bar is displayed on the left.
- From the left navigation bar, click Trip Dashboard
 , which is the first icon on the menu bar.
 A dashboard with a snapshot view of the trip's status is displayed.

- Monitor the widgets and their values that reflect the live data of the trip. Notice that the widgets and their values appear under four sections including Summary,Vehicle, Driver, and Associated Assets
- The Summary section displays the values for Trip Status, Delivery Status, Final Destination, Stops Completed, Start Time, Transit Duration, Fuel Consumed, Actual Distance, Total Incidents, and Total Alerts.
- The Vehicle section displays the assigned vehicle's name and its current status.
- The Driver section displays the assigned driver's name and current status.
- The Associated Assets section displays the number of equipment assets in transit, number of package assets in transit, and number of item assets in transit for the trip. These assets are well-known transport assets created and maintained in Oracle IoT Asset Monitoring Cloud. These transport assets are associated with the equipment, ship-unit, or ship-item sub-entities of the current trip.
- (Optional) Use the breadcrumb information to navigate to other entities of the current organization or to the organization dashboard.
View Trip Information
Trip info view displays information about a selected trip in categories such as, creation details, location, attributes, measurements, timings, and sensor device references.
As an administrator, you can view the trip info page to obtain complete information about a specific trip. You should ideally know the name of the trip in the current organization that you wish to view. You should be on the Operation Center.
- From the Operation Center menu options, click Trips
 .
.The trips summary view is displayed that lists all the trips of the current organization.
- From the list of trips, identify the trip name that you wish to monitor. Scroll to the last column of the record, hover your mouse, and click Actions, and then select Show Details.
The map view of the trip is displayed and a menu bar is displayed on the left.
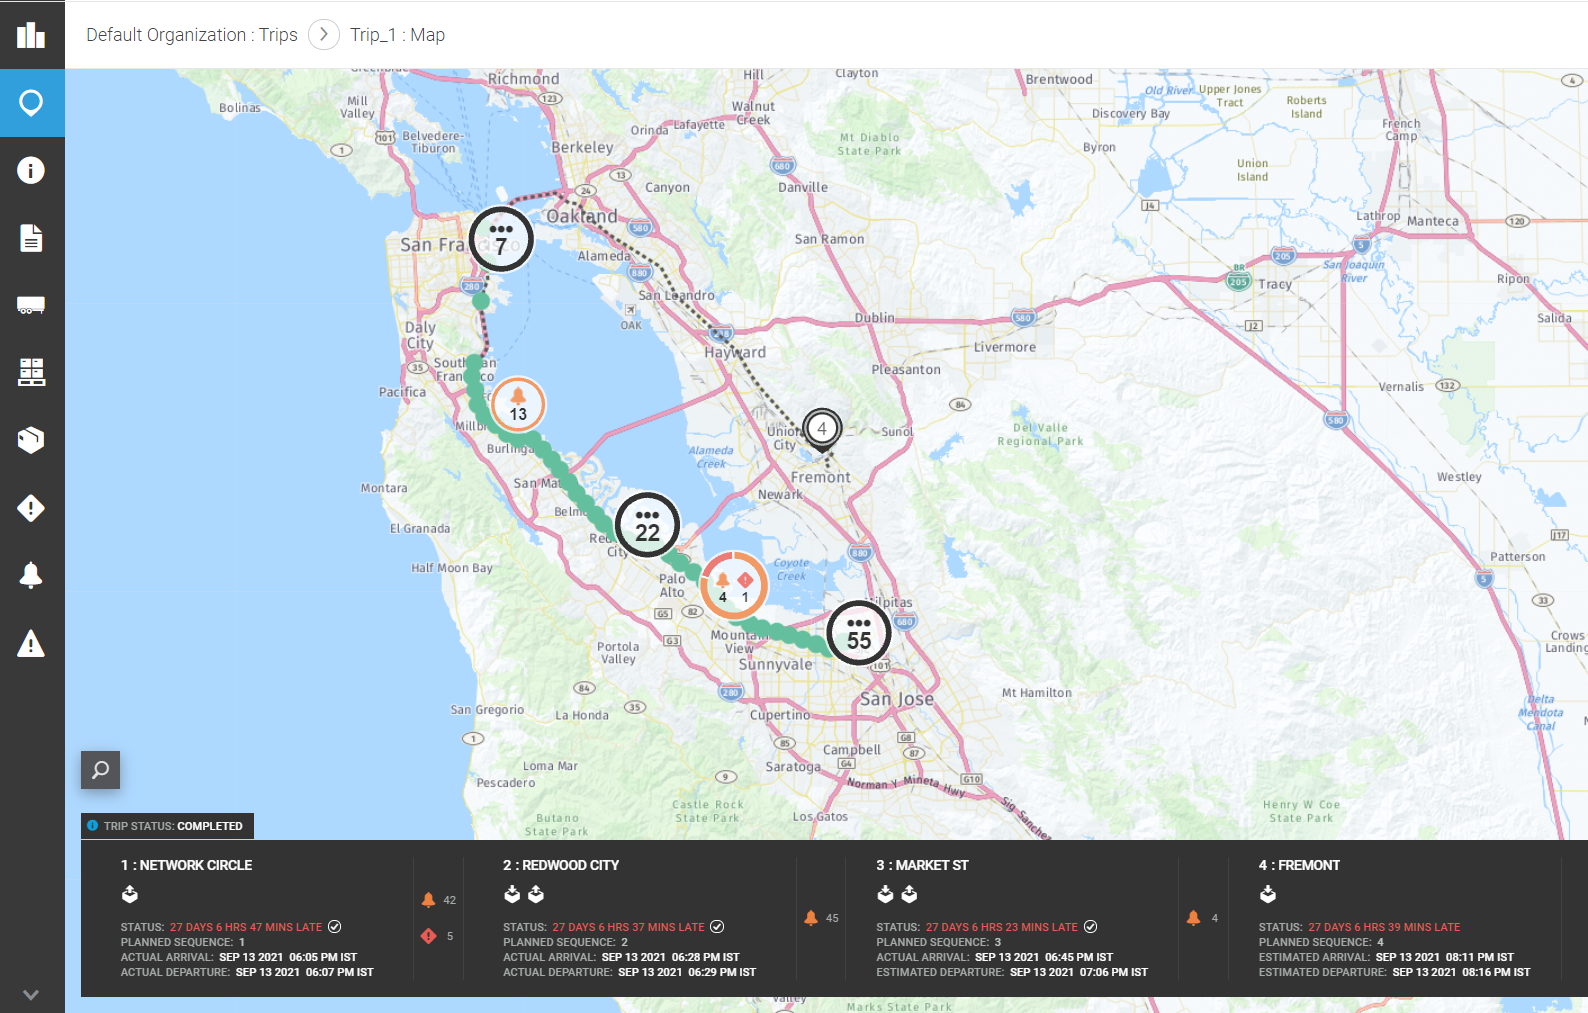
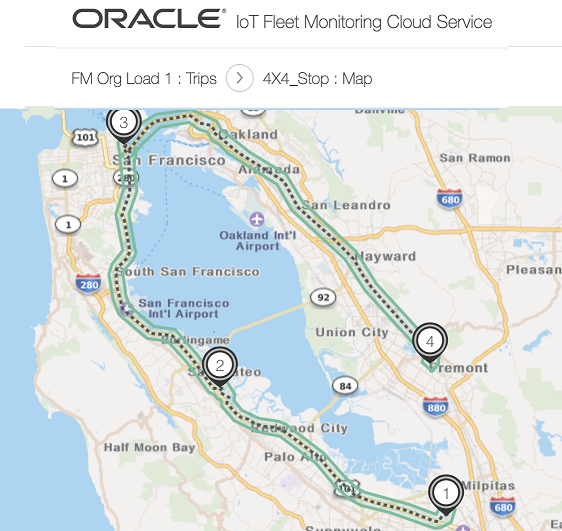
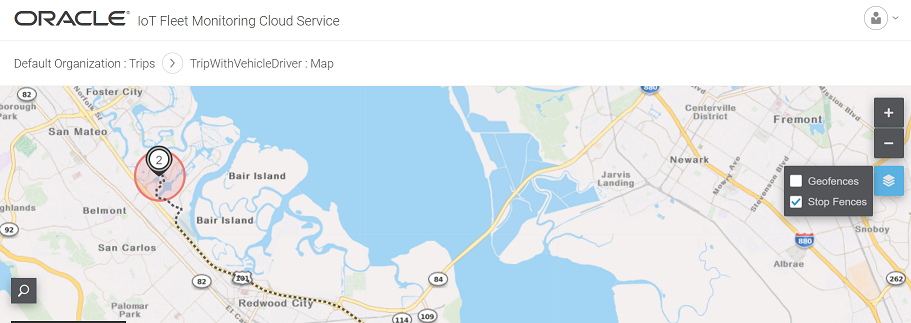
In the map view, a route (displayed as a dotted line) that is assigned by your map provider is displayed between the source and destination stops, including any optional stops inbetween. However, if your map provider is unable to fetch an assigned route for a given source and destination stops (for example due to network issues, or provider server issues, and so on), then a straight line connecting all stops is displayed.
- From the left navigation bar, click Trip Info
 , which is the third icon on the menu bar.
 A page with a snapshot view of the trip's information is displayed.

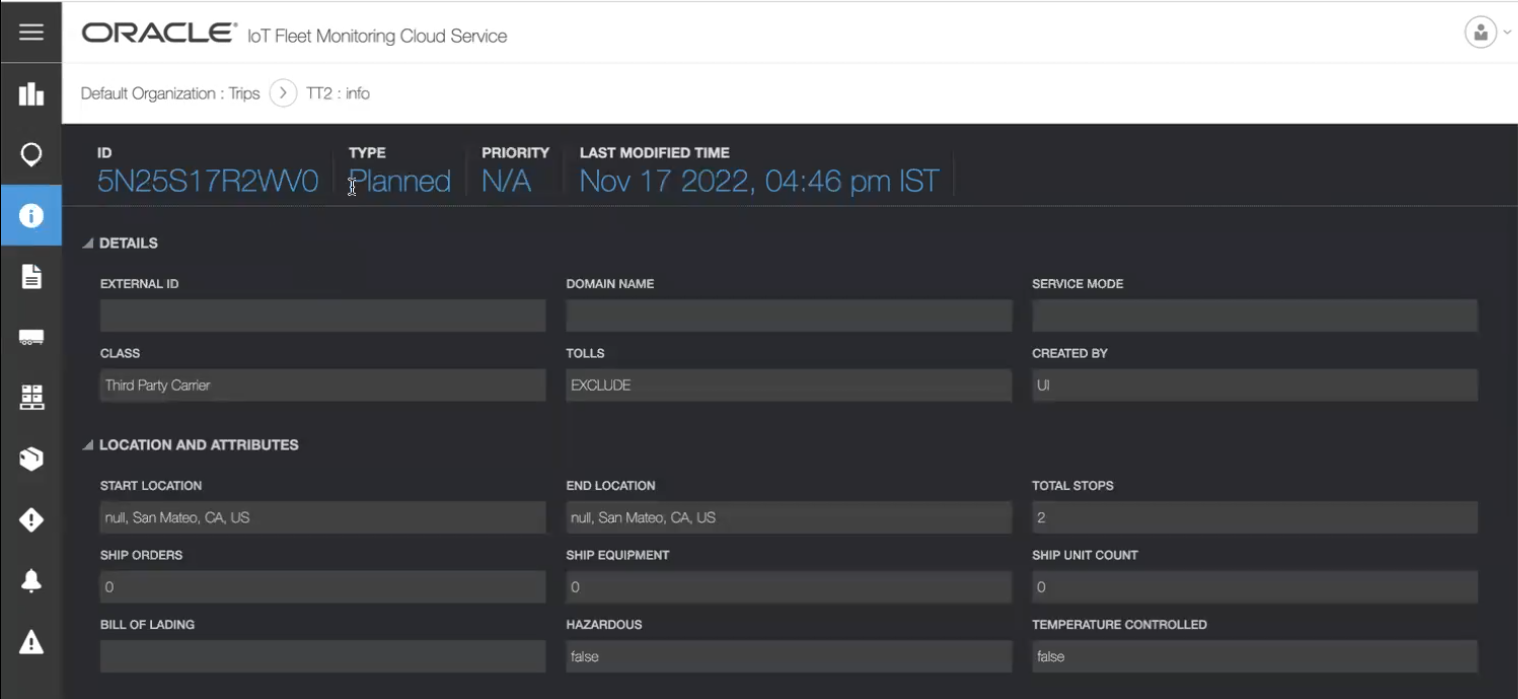
- View the header panel, categories and their data. The header panel displays the trip ID, type, priority, and last modified time. The categories that appear are Details,Location and Attributes, Measures, Timings, Sensor References, and Custom Attributes.
- The Details section displays the external ID, domain name, service mode, class, tolls, and created by. External ID and domain name are applicable for trips imported from Oracle Transportation Management Cloud Service.
- The Location and Attributes section displays addresses of the start and end stops, count of its sub entities and its associated data. The fields are start location, end location, total stops, ship orders, equipment, ship-units, ship-items, bill of lading, hazardous, and temperature controlled.
- The Measures section displays values of all measurements associated with the trip including total planned distance, total loaded distance, total unloaded distance, total weight, total volume, total wight, total volume, cost, total planned transit duration,and capacity utilization.
- The Timings section displays the various planned and actual timings of the trip such as, earliest start time, latest start time, actual start time, actual end time, planned start time, and planned end time.
- The Sensor References section displays the sensor devices associated in this tip
- The Custom Attributes section displays the name and values of additional attributes of the trips that have been imported from an external transportation application.
- (Optional) Use the breadcrumb information to navigate to other entities of the current organization or to the organization dashboard.
View Ship Orders of a Trip
Ship orders are metadata information that contains inventory data of a trip imported from an external application such as Oracle Transportation Management Cloud Service. The ship orders view displays information about the order, weight and volume of the inventory, and also timings for pick ups scheduled for the trip.
As an administrator, you can view the ship orders page to obtain complete information about the ship orders of a specific trip. You should ideally know the name of the trip in the current organization whose ship orders you wish to view. You should be on the Operation Center.
- From the Operation Center menu options, click Trips
 .
.The trips summary view is displayed that lists all the trips of the current organization.
- From the list of trips, identify the trip name that you wish to monitor. Scroll to the last column of the record, hover your mouse, and click Information
 .
.The map view of the trip is displayed and a menu bar is displayed on the left.
- From the left navigation bar, click Ship Orders
 , which is the fourth icon on the menu bar.
 A page with a list of the trip's ship orders is displayed.
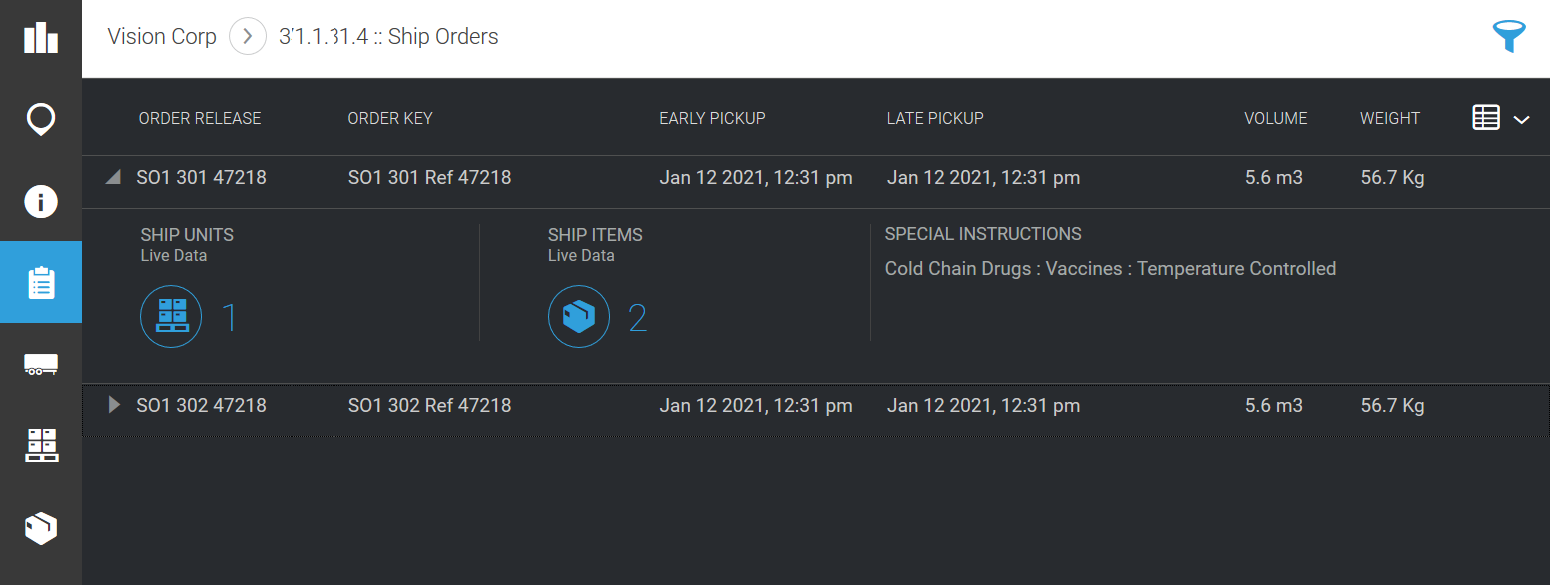
- View the fields and their data. Notice that the columns that appear are Order Release,Order Key, Early Pickup, Late Pickup, and Weight.
- To view the inventory associated with a ship order, expand the ship order record displayed in the list.
The details of the sub entities or inventory and special instructions associated with the ship order is displayed.

- To customize the information displayed on the Ship Orders view, on the table head, after the last column, click Show /Hide Columns
 . Select the check-box of the fields that you wish to include in the table. To close the list of fields, click outside the list.
The fields that you selected appear at the end of the last column of the table.
- (Optional) Use the breadcrumb information to navigate to other entities of the current organization or to the organization dashboard.
View Ship-Units of a Trip
Ship-units can contain one or more ship-items which contain the commodities for transport and delivery. A ship-item can contain commodities independent of ship-units. The Ship-Unit view and the Ship-Item view of a specific trip displays the details about these sub-entities of the trip including the linked sensors or assets.
As an administrator, you can view the ship-units page to obtain complete information about the ship-units or packages of a specific trip. Similarly the ship-items page displays information about ship-units that contain the commodity that is being transported for delivery. You should ideally know the name of the trip in the current organization whose ship-orders or ship-units you wish to view. You should be on the Operation Center.
- From the Operation Center menu options, click Trips
 .
.The trips summary view is displayed that lists all the trips of the current organization.
- From the list of trips, identify the trip name that you wish to monitor. Scroll to the last column of the record, hover your mouse, and click Information
 .
.The map view of the trip is displayed and a menu bar is displayed on the left.
- From the left navigation bar, click Ship Units
 .
. A page with a list of the trip's ship-units is displayed.
- View the fields and their data. Notice that the columns that appear are Ship Unit Number, Ship Unit Key, Ship Unit Type, Order Release, Count, Commodity, Linked, Alerts, and Open Incidents.
- To view the sensors or assets associated with a ship-unit, expand a ship-unit record displayed in the list.
The details of the sensors or assets and special instructions associated with the ship unit is displayed.

To view the digital twin of the linked asset or sensor, towards the left of the asset details, click  . If the trip is in a planned state or has not completed, Edit
  is enabled to modify the assets or sensors linked to the equipment, if needed. See Associate Sensors or Well-Known Assets to an Entity of a Trip.
- To customize the information displayed on the Ship Units view, on the table head, after the last column, click Show /Hide Columns
 . Select the check-box of the fields that you wish to include in the table. To close the list of fields, click outside the list.
The fields that you selected appear at the end of the last column of the table.
- (Optional) Use the breadcrumb information at the top of the page to navigate to other entities of the current organization or to the organization dashboard.
View Trip Equipment Details
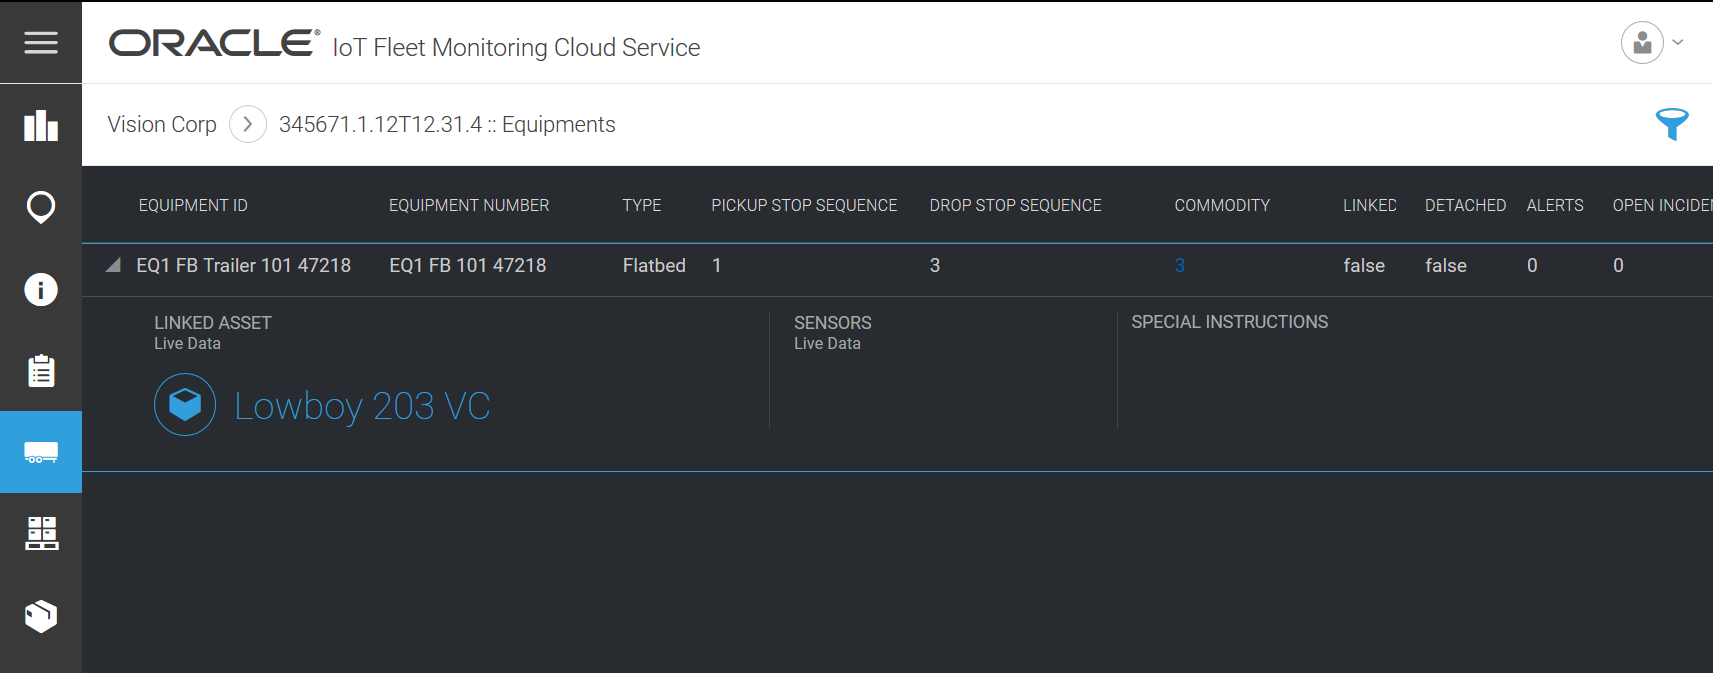
Equipment is a trailer or a container that contains ship units or ship items. It is a sub entity of a trip that has been imported from an external application such as Oracle Transportation Management Cloud Service. The equipments view of a trip displays information about the equipment, open incidents and alerts raised due to the equipment, its associated pickup and drop stops, commodity it is carrying and also the sensors or assets linked to it..
As an administrator, you can view the equipment page to obtain complete information about the equipment associated with a specific trip. You should ideally know the name of the trip in the current organization that you wish to view. You should be on the Operation Center.
- From the Operation Center menu options, click Trips
 .
.The trips summary view is displayed that lists all the trips of the current organization.
- From the list of trips, identify the trip name that you wish to monitor. Scroll to the last column of the record, hover your mouse, and click Information
 .
.The map view of the trip is displayed and a menu bar is displayed on the left.
- From the left navigation bar, click Equipments
 .
. A page with a list of equipment associated with a trip is displayed.
- View the fields and their data. Notice that the columns that appear are Equipment ID,Equipment Number, Type, Pickup Stop Sequence, Drop Stop Sequence, Commodity, Linked, Detached, Alerts, and Open Incidents.
- To view the hip units or ship items associated with an equipment expand the equipment record displayed in the list.
The details of the assets or sensors and special instructions associated with the equipment is displayed.

To view the digital twin of the linked asset or sensor, towards the left of the asset details, click  . If the trip is in a planned state or has not completed, Edit
  is enabled to modify the assets or sensors linked to the equipment, if needed. See Associate Sensors or Well-Known Assets to an Entity of a Trip.
- To customize the information displayed on the Equipment view, on the table head, after the last column, click Show /Hide Columns
 . Select the check-box of the fields that you wish to include in the table. To close the list of fields, click outside the list.
The fields that you selected appear at the end of the last column of the table.
- (Optional) Use the breadcrumb information to navigate to other entities of the current organization or to the organization dashboard.
View Ship-Items of a Trip
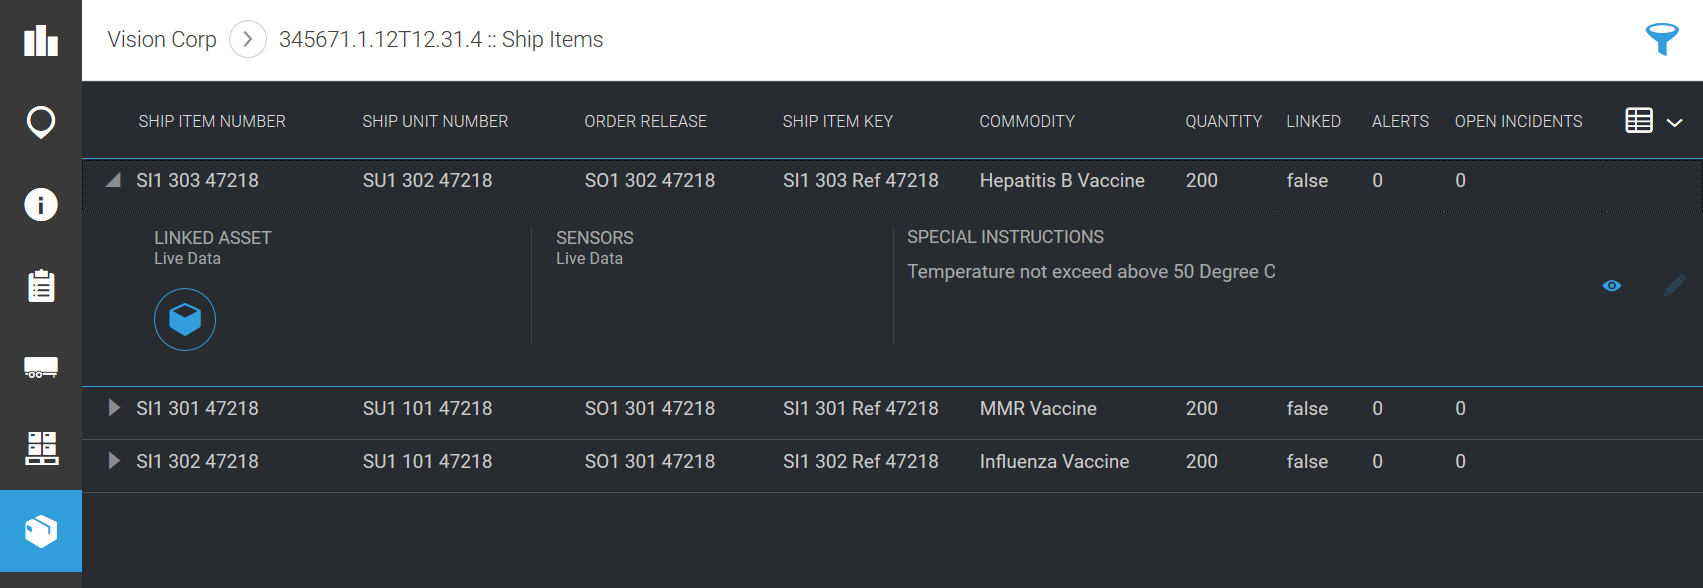
Ship-units can contain one or more ship-items which contain the commodities for transport and delivery. A ship-item can contain commodities independent of ship-units. The Ship-Unit view and the Ship-Item view of a specific trip displays the details about these sub-entities of the trip including the linked sensors or assets.
As an administrator, you can view the ship-items page to obtain complete information about the ship-items containing commodities being transported for delivery in a specific trip. You should ideally know the name of the trip in the current organization whose ship-items you wish to view. You should be on the Operation Center.
- From the Operation Center menu options, click Trips
 .
.The trips summary view is displayed that lists all the trips of the current organization.
- From the list of trips, identify the trip name that you wish to monitor. Scroll to the last column of the record, hover your mouse, and click Information
 .
.The map view of the trip is displayed and a menu bar is displayed on the left.
- From the left navigation bar, click Ship Units
 .
. A page with a list of the trip's ship-items is displayed.
- View the fields and their data. Notice that the columns that appear are Ship Item Number, Ship Unit Number, Ship Item Key, Order Release, Quantity, Commodity, Linked, Alerts, and Open Incidents.
- To view the sensors or assets associated with a ship-item, expand a ship-item record displayed in the list.
The details of the sensors or assets and special instructions associated with the ship-item is displayed.

To view the digital twin of the linked asset or sensor, towards the left of the asset details, click  . If the trip is in a planned state or has not completed, Edit
  is enabled to modify the assets or sensors linked to the equipment, if needed. See Associate Sensors or Well-Known Assets to an Entity of a Trip.
- To customize the information displayed on the Ship Items view, on the table head, after the last column, click Show /Hide Columns
 . Select the check-box of the fields that you wish to include in the table. To close the list of fields, click outside the list.
The fields that you selected appear at the end of the last column of the table.
- (Optional) Use the breadcrumb information to navigate to other entities of the current organization or to the organization dashboard.
Manage Incidents for a Trip
Incidents are raised in a trip when a rule condition for a trip or any of its sub entities are not met. You can view and manage all the incidents of a specific trip from the Incidents view of a trip.
As an administrator, you can view the incidents page to obtain the list of incidents raised in a specific trip. You can update the status of each incident and enter your specific comments for the incident. You should ideally know the name of the trip in the current organization whose incidents you wish to view. You should be on the Operation Center.
- From the Operation Center menu options, click Trips
 .
.The trips summary view is displayed that lists all the trips of the current organization.
- From the list of trips, identify the trip name that you wish to monitor. Scroll to the last column of the record, hover your mouse, and click Information
 .
.The map view of the trip is displayed and a menu bar is displayed on the left.
- From the left navigation bar, click Incidents
 .
. A page with a list of the incidents raised for the trip is displayed.
- View the fields and their data. Notice that the columns that appear are Rule Type, State, Priority, Created, Type.
- To customize the information displayed on the Incidents view, on the table head, after the last column, click Show /Hide Columns
 . Select the check-box of the fields that you wish to include in the table. To close the list of fields, click outside the list.
The fields that you selected appear at the end of the last column of the table.
- To view the associated trip route on the map and locate the stop at which the incident was raised, beside the name of the incident click Information
 .
.
- To update the status of the incident or add your comments to it, towards the end of the record, clickEdit
 .
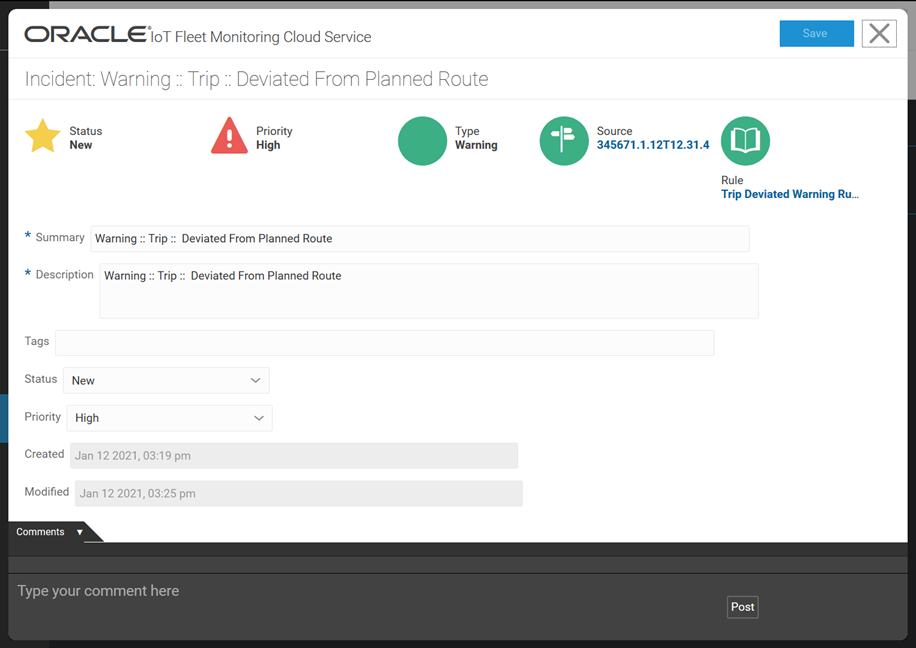
.The incident page is displayed.

- To manage the incident, update the Status field, enter comments in the Comments section, and click Post.
To open the dashboard of the associated trip, click the trip name appearing in Source at the top of the page
To modify the underlying rule, click the rule name appearing in Rule. Edit the rule conditions or any field if needed and click Save.
- On the incident page, click Save.
- (Optional) Use the breadcrumb information to navigate to other entities of the current organization or to the organization dashboard.
(Optional) Enter the result of the procedure here.
View Digital Twin Details
Oracle IoT Fleet Monitoring Cloud Service creates a digital twin version of the sub-entities of a trip including the vehicle, equipment, ship-units, and ship-items and lets you monitor the sensors and their values such as, temperature, pressure, shock, humidity, ambient temperature, tamper detection, tilt, light, and so on.
Before you can view the digital twin versions of the sub-entities of a trip imported from
Oracle Transportation Management Cloud
Service, you should have associated the sub-entities with sensor devices or assets See
Associate Sensors or Well-Known Assets to an Entity of a Trip. For seeing values of the sensor devices in their digital twin views, the trip's state should be en-route or completed.
- Click Menu
 and then click Operation Center.
- On the operation center navigation bar, click Trips
 .
.The trips summary view of all the trips in the organization is displayed.
- Identify the trip record for which you need to view the digital twin versions of the devices or assets of its sub-entities and hover over it towards its last field. Click
 for that record.
Note:
Select a trip that is in the en-route or completed state. Sensor devices or assets though associated get linked with the sub-entities only after a trip has started.
The trip is displayed on the map view.
- From the Trip navigation bar, select the entity for which you need to see the digital twin and then click one of the following icons:
- Equipment

- Ship Units

- Ship Items

The selected entity's page is displayed with the list of equipment, ship-units, or ship-items associated with the trip.
- From the list, for equipments identify the equipment ID, for ship-units identify the ship-unit ID, or for ship-items identify the ship-item ID and expand its value. Towards the other end of the record, click

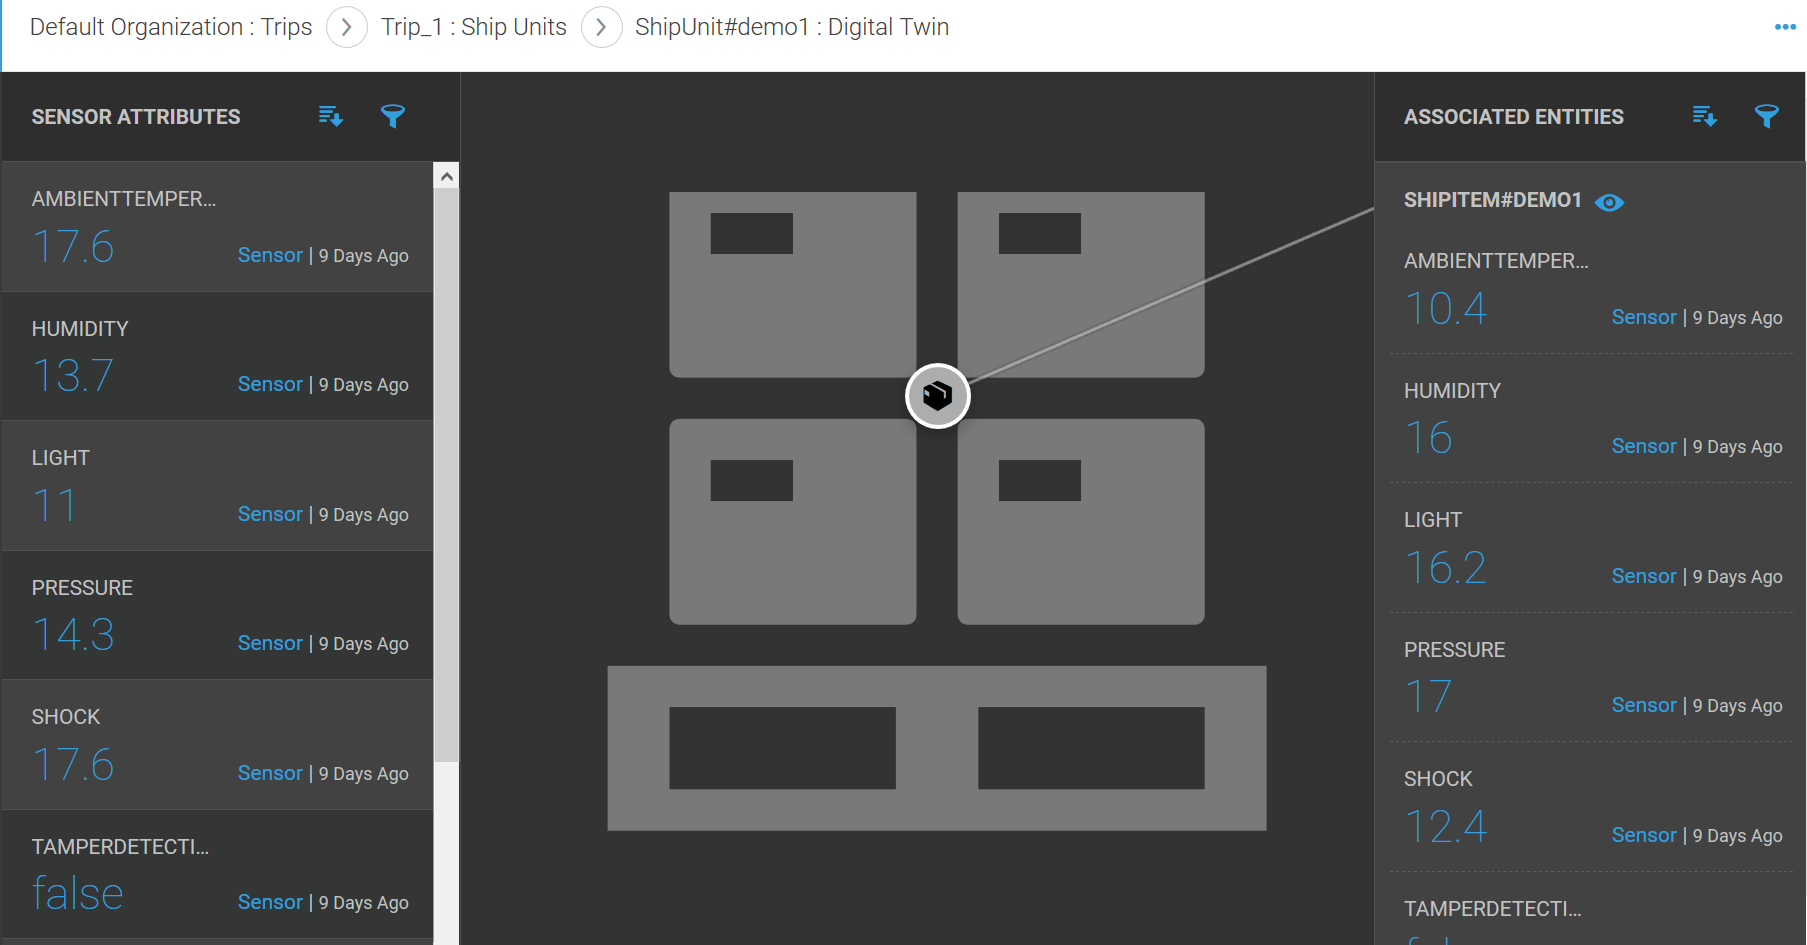
The digital twin view of the sub-entity is displayed.

- On the left frame, examine the values of the sensor attributes associated with the entity. Use the Sort
 icon to sort the attributes in the list. Use the Filter
  icon to search for specific attributes.
- (Optional) To view the attributes in an order, click the Sort
 icon and select one of the following options:
- Sort by Attribute Name (A-Z)
- Sort by Attribute Name (Z-A)
- Sort by Last Updated
- (Optional) To search and display specific attributes, click the Filter
 icon. Enter or select the following in the Filter dialog box:
- From the Filter drop down, select Attribute Name and choose contains, matches, or does not contain.
- Enter a value in the Value text box and press enter.
- (Optional)Click Add to create additional filter conditions.
- Click Apply.
The filtered results are displayed.
- For a graphical view of an attribute over a time period, click the attribute value. On the graphical view select one of the following options from the Date Time Window drop down.
- Live
- 1 hour ago
- 24 hours ago
- 7 days ago
- 14 days ago
To disable or enable live refresh of attribute data from the sensor devices, on the top right corner of the window, click the Digital Twin Menu ... icon and select Disable Live Refresh or Enable Live Refresh.
Review the data and click
Close 
.
- The central frame displays the digital image of the entity including its associated entity. For example an equipment displays the ship units and a ship unit displays its associated ship items contained in it. Review the attributes of the associated entity displayed on the right.
- (Optional) On the Associated Entities section, use the Sort
 icon to view the attribute values in a sorted order. Use the Filter
  icon to search for a specific attribute value.
- To view the graphical data of an attribute of the associated entity over a specific time period, click the attribute. Choose an option from the Date Time Window drop down. Examine the graphs and click Close

- To view its associated entity and their sensor attribute values, click

- To view the digital twin of an associated entity, for an entity, click

- Use the links in the breadcrumb to navigate back to the parent entity's digital twin view.
Manage Exceptions Raised for a Trip
Exceptions are notifications raised for a trip or any sub-entity of a trip including a vehicle, equipment, ship-units, and ship-items when the sensor device or asset associated with an entity is already in use for monitoring another entity of an en-route trip. You can fix the asset associations or device links and resolve exceptions.
As an administrator, you can view the exceptions page to obtain the list of exceptions raised in a specific trip. You can review the exception details, edit the device links, and resolve it. You should ideally know the name of the trip in the current organization whose exceptions you wish to view. You should be on the Operation Center.
- From the Operation Center menu options, click Trips
 .
.The trips summary view is displayed that lists all the trips of the current organization.
- From the list of trips, identify the trip name that you wish to monitor. Scroll to the last column of the record, hover your mouse, and click Information
 .
.The map view of the trip is displayed and a menu bar is displayed on the left.
- From the left navigation bar, click Exceptions
 .
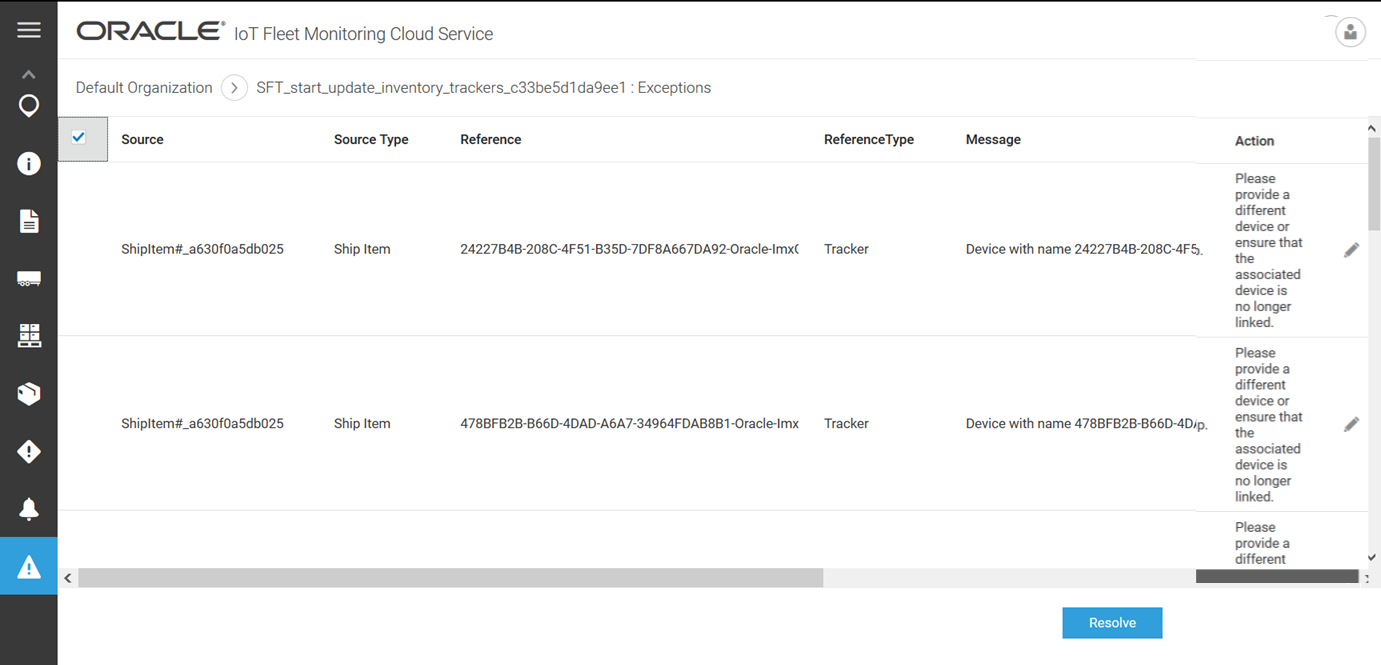
. A page with a list of the exceptions raised for the trip is displayed.

- View the fields and their data. Notice that the columns that appear are Source, Source Type, Reference, Reference Type, Message, and Action.
The Source Type field provides the type of sub-entity that is linked to the sensor device, which is referred in the Reference field.
- Make a note of the value in Reference. To edit the associated device link, towards the end of a record, click Edit
 .
.
- On the Exceptions view, select the check box for the exception that you edited and fixed, and then click Resolve.
The exception is removed from the list.
- (Optional) On the exceptions page, use the breadcrumb information to navigate to other entities of the current organization or to the organization dashboard.
