Account Performance dashboard
Important: Effective June 12, 2025, Oracle Eloqua's Advanced Intelligence (AI) features are available for all customers. To enable Eloqua's classic and Generative AI (Gen AI) functionality, open a service request with Oracle Support. Please review our product notice for more information.
The Account Performance dashboard provides a detailed view of an individual account's performance, including engagement score, marketing activities, and engaged contacts. This dashboard is part of the Account Intelligence feature.
Click a link below to find out more about this dashboard:
- Good to know
- Dashboard filters
- Dashboard metrics
- Performance tiles
- Understanding the charts on the dashboard
Good to know
- The dashboard shows you the selected account's performance for the last 90 days.
- Accounts are determined using either the account to contact linkage or the contact's company name. For example, if a contact has an account linkage, the activity is associated to the linked account name. Whereas, if a contact does not have a linked account, the activity is associated to the company name. You can use the Account Source column to understand the source of the account name.
- The Account Engagement Score indicates how engaged an account is based on email opens, clickthroughs, and form submissions. Learn more about Account Engagement Score mechanics.
- Account are scored weekly based on the last 90 days of activity.
Dashboard filters
The following filters are available in the Filters section:
- Activity Date Range: The activity time frame of the dashboard. Accounts must have clickthroughs, form submits, external activities, or page views during this time frame to be included.
- Account Search: The account you want to view. Accounts are determined using either the account to contact linkage or the contact's company name. To select a different account, enter the name of the account and click Search.
Dashboard metrics
| Metric | Description |
|---|---|
| Engagement Score | The current engagement score based on email open rate, clickthrough rate, and form submission rate as well as the change in score (up or down) from the previous 90 day period. |
| Engaged Activities | The total number of activities such as email opens, email clickthroughs, and form submissions as well as the individual count for each from the previous 90 day period. |
| Engaged Contacts | The total engaged contacts and the change from the previous week. |
| Clickthroughs | The total clickthroughs. This includes multiple clicks by the same recipient. System Action links are not tracked. |
| Form submissions | The total forms submitted. This includes multiple submissions by the same contact. |
| Opens | The total opens by email recipients (original recipients or email forwards). An open is counted every time the email is opened. |
| Reachable contacts | The total number of contacts who are reachable. Reachable contacts are contacts with email addresses that have not hard bounced or have not globally unsubscribed. |
Performance tiles
Engagement Score
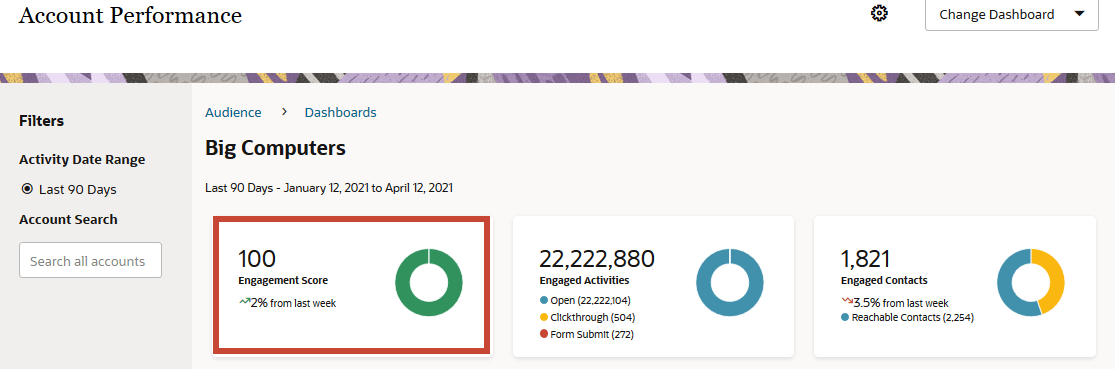
The Engagement Score tile shows the current Account Engagement Score based on email open rate, clickthrough rate, and form submission rate as well as the change in score (up or down) from the previous 90 day period.
The Account Engagement Score indicates how engaged an account is. The higher the score, the more engaged the account is and its contacts. The score values range from 0 - 100.
The engagement activities used to calculate engagement scores are form submissions, email clickthroughs, and email opens.
Engaged Activities

The Engaged Activities tile lists the total number of activities as well as the total email opens, email clickthroughs, and form submissions for the last 90 days.
Engaged Contacts

The Engaged Contacts tile lists the total engaged contacts and the change in score (up or down) from the previous 90 day period. Additionally, you can use the circle chart to see how many of those engaged contacts were unreachable and how many were reachable.
Understanding the charts on the dashboard
Engagement Timeline
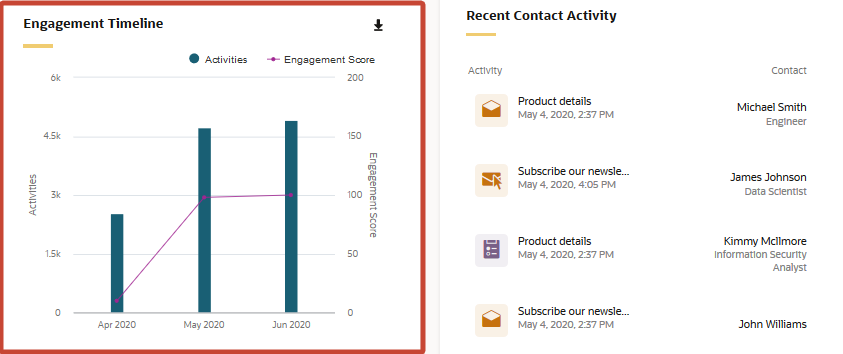
This chart shows the last three months of engagement scores and total engagement activities. The timeline for this chart is the last 3 months, and the score is from the end of the month.
Recent Contact Activity

This chart shows the recent activities for the account by contact. A maximum of 50 activities are shown by order of recency. For each activity shown, the dashboard shows the asset name, activity type, activity date, contact name, and title.
Top 10 Assets

This chart provides a list of the top 10 assets by total activities (based on opens, clickthroughs, and form submits) from the previous 90 day period.
Top 10 Campaigns
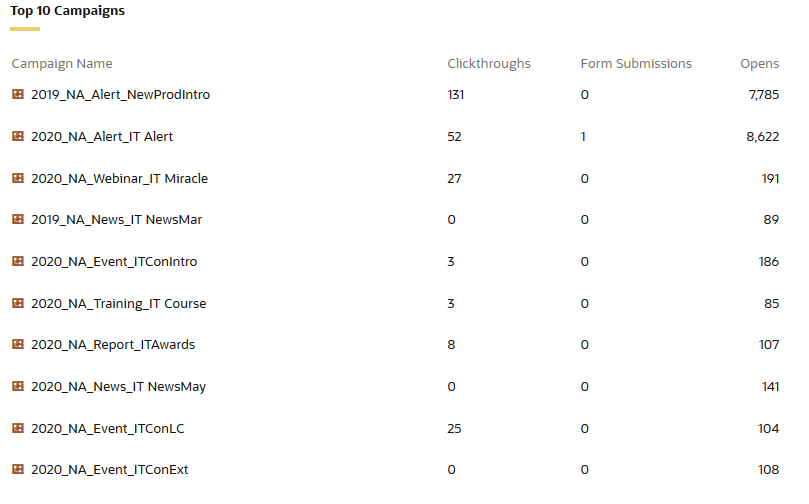
This chart provides a list of up to 10 top campaigns for the account and their total clickthroughs, form submissions, and email opens.