Report table
Whether you are tracking a campaign or determining your top device types per country, the Infinity report table is an intuitive canvas for examining your data and has the following structure:
- Dimensions appear in the left column and remain visible even as the table scrolls horizontally. You can add, remove, or rearrange dimensions.
- Measures appear across the top row of the table and remain visible as the table scrolls vertically. You can add and remove measures, and change the order of the columns.
- All cells outside of the left column and top row show calculations of your data.
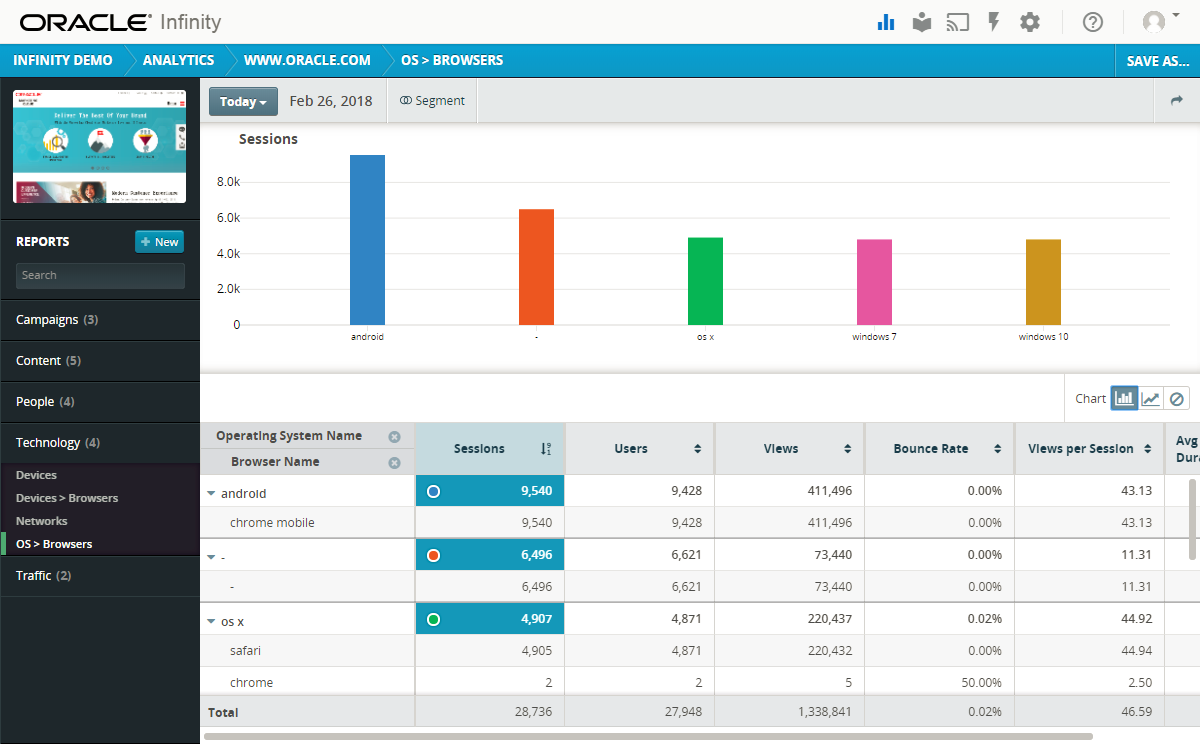
In the following example, the dimension is Operating System Name and the measures are Sessions, Users, Views, Bounce Rate, and Views per Session.
As you modify your view of a report, such as adding dimensions, measures, and segments, the report will be requeried and its graph will refresh.
Reading a table with multiple dimensions