Interacting with Insight Dashboards
Insight Interactive Dashboards is your one-stop shop for analyzing the performance of all your channels. Oracle Responsys provides dashboards and sub-dashboards for each channel: Email, SMS & MMS, Mobile Apps, and Web Push. For an overview of the Dashboards, see Dashboards Overview.
To navigate to Insight Interactive Dashboards:
- Click Insight
 on the side navigation bar, and select Interactive Dashboards.
 - Choose a tab and review the dashboard.

 Select the functional area you want to see.
 Click the arrow to access a group, then click the name of the report you want to see.
  Select the search criteria and sent date range for the reports.
 - Use the search criteria to search for and select values to filter the results on the dashboard. The values on each prompt act as an AND condition on the filter. The available search criteria vary by channel and dashboard. You can select multiple values and specify more search criteria such as a string in a name. To do this, click the arrow next to the criterion and select the values you want.
- If you do not select any filtering criteria, data is shown for the entire account.
- If you do not select a data range, data is shown for the past 7 days.
 Click this button to apply your selection criteria.
 Click this button to reset the selection criteria to either the default or last applied values.
 Click this button to view online help for the dashboard. You may need to maximize the Interactive Dashboards window or scroll all the way to the right to see this button.

Learn more about interacting with the dashboards:
Navigating Charts
After you select a channel, the Dashboard shows charts and key performance metrics for that channel. You can change the metrics and drill down each chart.
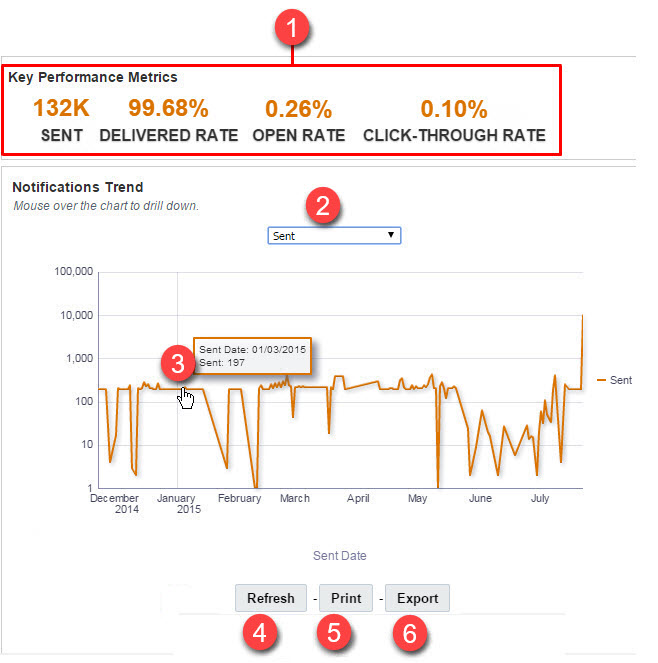
Shows the key performance metrics for the channel.
Select the metric or comparison you want.
Point at a data point to see a summary. Click a data point to drill down for detailed analysis. For information about the available details for each chart, see specific chart descriptions.
Click this button to refresh the data in the chart.
Click this button to create a printable chart in either PDF or HTML format.
Click this button to export a chart or report data. When you export a report, the formatting, data, and filters are exported. You can export the report in the Excel, PDF, or Web Archive formats.
When you export data, only the column names and data are exported, not the formatting or filters you applied. You can export data in the CSV, tab delimited, or XML format.
Tip: To export data at a lower level, drill down to the level you want.
Navigating Reports

Click a blue column heading to drill down to more detail.
Click this icon to open the detailed analysis of the campaign.
To sort on a column, point at its heading and select the up or down arrow.
Shows the specified search criteria. The Event Date is the starting point of the date range.
Click this button to refresh the data in the report.
Click this button to create a printable report in either PDF or HTML format.
 Click this button to export a report or report data. When you export a report, the formatting, data, and filters are exported. You can export the report in the Excel, PDF, or Web Archive formats.
When you export data, only the column names and data are exported, not the formatting or filters you applied. You can export data in the CSV, tab delimited, or XML format.
Tip: To export data at a lower level, drill down to the level you want.
Navigating Dashboards
After you select a category, click a report name to see a specific report. In a report, you can:
- Drill down to more detailed data for an attribute
To do this, click the column title of the attribute you want.
- Analyze data for a specific value
To do this, click the value to drill down to more detail.
- Add, remove, and move columns in tabular views.
To do this, right-click anywhere in the table.
- Sort table columns
To do this, right-click the column title and select the option you want.
To see whether you can drill down on a column or value, hover over the item you want. If it appears as a link, you can click it to drill down.
To return to a previous page, click a navigation link at the bottom of the page.
