Navigating the Predictive CLV dashboard
Important: This feature is available as part of the Advanced Intelligence Package add-on that must be ordered for your account. Please contact your account manager or Oracle sales.
With the Predictive CLV dashboard, you can visualize a profile list's historical and predicted purchasing trends.
In this topic, you'll learn about:
See also Additional topics for understanding CLV.
Prerequisite: purchase data
Predictive CLV requires at least 6 months of purchase data. Ensure that you have set up conversion tracking and revenue tracking so that CLV can gather the required data.
Navigating the Predictive CLV dashboard
To navigate to the Predictive CLV page:
- Click Insight
 on the side navigation bar.
 - Select Predictive CLV.

The Customer Lifetime Values page displays the Predictive CLV charts. Additionally:
 You can Download the dashboard's data, or see when it was last refreshed.
 If your account has multiple profile lists, you can change the profile list using the List name drop-down at the top of the page.
Predictive CLVs chart
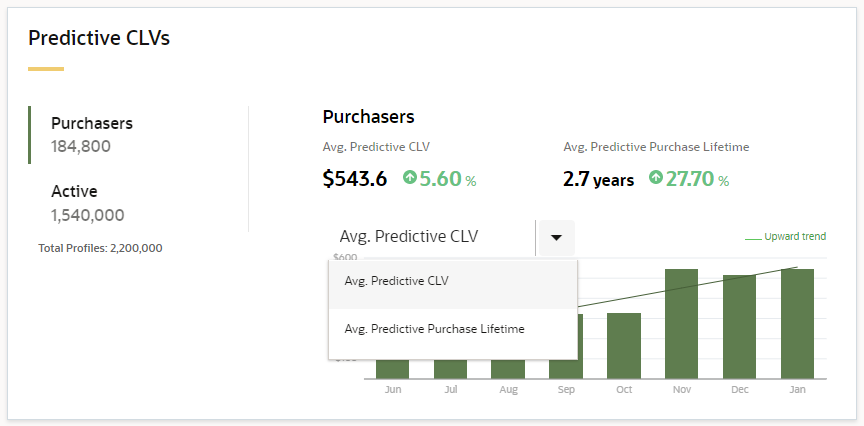
The Predictive CLVs chart displays past predictions for your profile list's average predictive CLV and average predictive purchase lifetime. Once Predictive CLV is enabled for your account, every time a month ends, the chart displays what had been predicted for that month's average predictive CLV and average predictive purchase lifetime. For example, if your account has had Predictive CLV enabled since February 1st, and it is April 25th (which is 2 months of complete data), then the Predictive CLVs chart displays what the predictions were for those two past months, February and March. If it is now May 25th, you'll see the predictions that were given for February, March, and April.
You can view your profile list's Avg. Predictive Purchase Lifetime trend or its Avg. Predictive CLV trend. Use these charts to evaluate whether marketing efforts are successful in driving up your customer lifetime values.
Additionally, you can view these trends through the lens of profiles that are either Active or Purchasers:
- Active: all the profiles in your list with an RFM recency that is greater than or equal to 3 out of a possible 5.
Note: RFM scoring needs to be enabled for your account so that Predictive CLV can determine which profiles in your list are active recipients.
- Purchasers: all profiles in your list that have made a purchase.
Beneath the number of Purchasers and Active profiles, you'll see the total number of profiles in your list that are deliverable and opted in.
Predictive Revenue chart
The Predictive Revenue chart displays two views for the profile list's revenue. The first view is the historical total revenue over the last 3 months, 6 months, and 12 months.
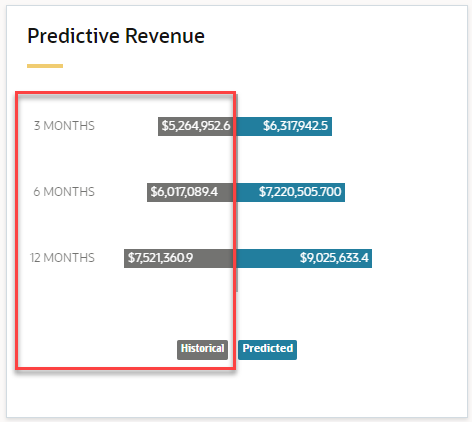
The second view displays the predictive total revenue for three different forecast periods: the next 3 months, the next 6 months, and the next 12 months.

This chart helps marketers get an estimate of total revenue in the short, medium, and long-term, which can help with financial planning. The currency used in the chart is the default currency for the account.
Predictive Personas charts
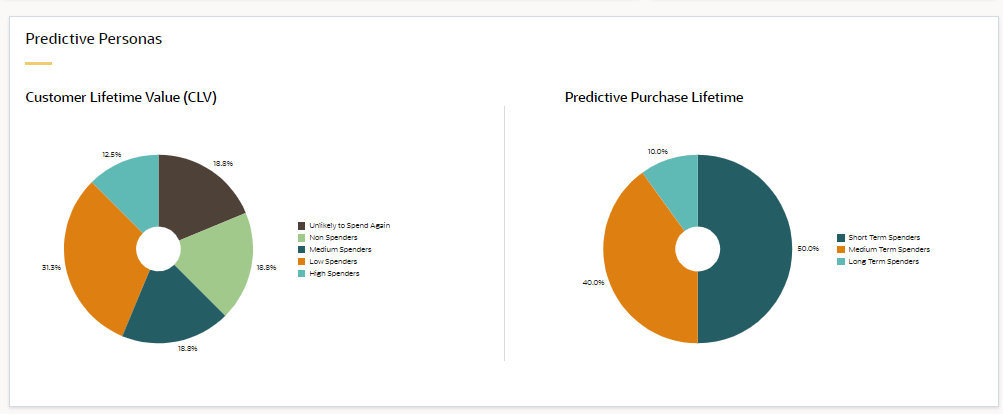
The Predictive Personas charts display the Predictive CLV personas. These charts help marketers visualize the distribution of profiles across the different personas:
-
Customer Lifetime Value (CLV): The range of predictive CLV of all profiles is calculated then divided into personas based on algorithms. Those personas currently are:
-
Low spenders - Customers likely to spend again, but were placed in the lowest spending persona.
-
Medium spenders - Customers likely to spend again, but in moderate amounts.
-
High spenders - Customers likely to spend again, and spend the most of all personas.
-
Non-spenders - Customers who will almost surely will not spend again. These customers are excluded from the calculations for predicting average future spending.
-
Unlikely to spend again - Customers with a low likelihood of spending again, if there are any that fit this persona. These customers are excluded from the calculations for predicting average future spending.
For example, algorithms applied to customer profile purchasing data result in a maximum predictive CLV of $3,001. Non-spenders and 'Unlikely to spend again' profiles are excluded. Previous purchasers across a defined range (for example, from $1 to $3,001) are then divided into the three remaining personas. A profile with a predictive CLV of $100 might fall into the Low spenders persona, $1,500 would fall into Medium spenders, and $2,500 would fall into High spenders. Ranges for personas change dynamically, based on changes in the customer profile data.
The percentage of profiles in each persona is displayed outside the pie chart sector for that persona. The number of profiles in each persona can be viewed by hovering over or clicking the pie chart segments.

-
-
Predictive Purchase Lifetime: The range of predictive purchase lifetime of all profiles is calculated. Non-spenders, 'Unlikely to spend again' and customers with a predictive lifespan of less than 135 days (halfway between 3 and 6 months) are excluded. Those remaining are then divided into three personas: Short, Medium, and Long term spenders.
For example, if the maximum predictive purchase lifetime is 3,001 days, then the range from 135 to 3,000 days would be divided into the three personas. For example, a profile with a predictive purchase lifetime of 200 days would fall into the first persona, Short term spenders, 600 days would fall into Medium term spenders, and 2,500 days would fall into Long term spenders. Ranges for personas change dynamically.
The percentage of profiles in each persona is displayed outside the pie chart sector for that persona. You can view the number of profiles in that persona by hovering over or clicking the pie chart segment.


Additional topics for understanding CLV
- Predictive CLV overview
- Navigating the Predictive CLV dashboard (You are here)
- Using the CLV prebuilt PETs
- Understanding CLV PET fields