RFM for the Mobile App Channel
In this topic, learn about RFM for the Mobile App Channel. You'll learn about the mobile channel use cases and the different sections of the RFM mobile dashboard.
In this topic:
- RFM Mobile App Channel Use Cases
- Mobile Analysis Overview
- Micro-segment chart
- Monetary Distribution
- Configurations
To navigate to the RFM page:
- Click Insight
 on the side navigation bar.
 - Select RFM > Mobile App.
RFM Mobile App Channel Use Cases
RFM for the Mobile App Channel enables marketers to identify mobile app campaign engagement. The RFM mobile channel use cases include:
-
Push Campaign Engagement
-
In-App Campaign Engagement
-
Message Center Engagement
These use cases are displayed in the Mobile App RFM dashboard when selecting a Mobile App and Recency and Frequency Event.
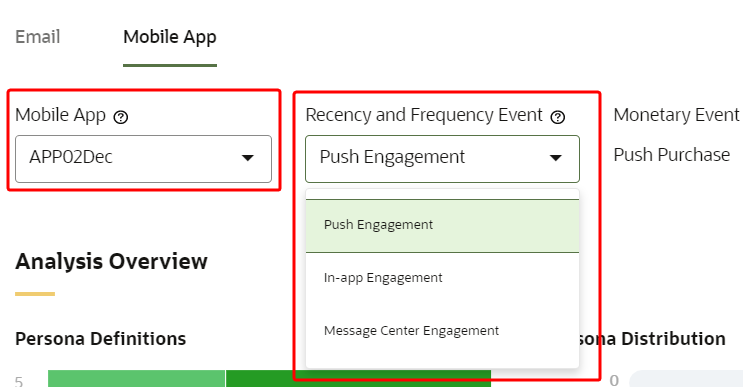
By selecting these dimensions, marketers can gain insight into the RFM analysis for each of their mobile apps, and the corresponding use case.
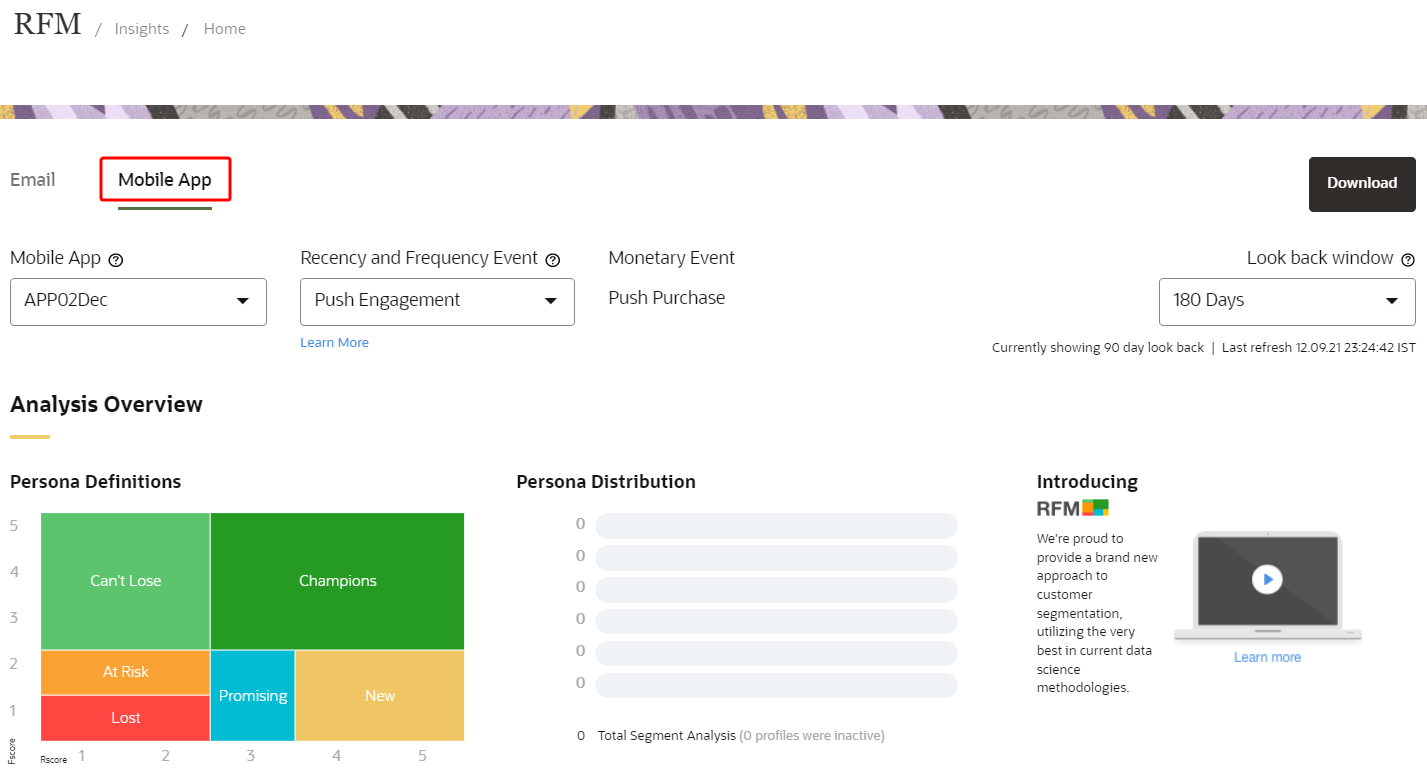
Mobile Analysis Overview
There are two dimensions that determine the Mobile RFM analysis:
-
Mobile App
-
Recency and Frequency Event
When these two dimensions are specified, in the Analysis Overview panel, you will find:
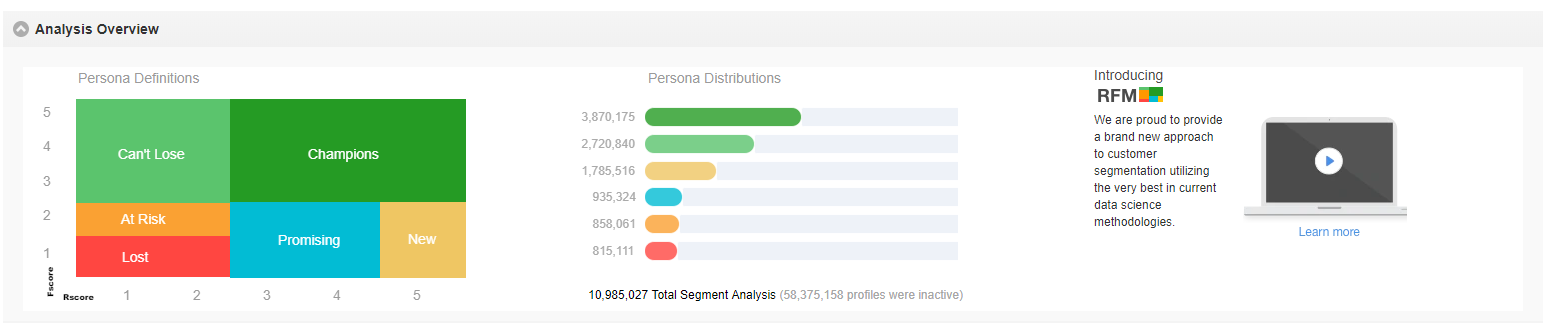
- Persona Definitions legend: Use this legend to understand what the distribution of data means on the RFM dashboard, and to see how the dashboard's visuals relate to the RFM Scores and Personas.
Tip: The RFM dashboard displays RFM personas calculated for a particular Mobile App and use case (displayed in the UI as Recency and Frequency Event). Selecting different mobile apps from the drop-down will display the RFM personas for that specific mobile app. Similarly when selecting a different use case, the RFM dashboard displays the RFM personas for that specific use case.
- Persona Distributions chart: Use this chart to see how your mobile app users are distributed across each persona.
Tip: Underneath the Persona Distributions chart, you will see the number of mobile app users that were inactive. Inactive profiles are mobile app users with no engagement activity.
- Introducing RFM section: Use this section to learn more about RFM.
Micro-segment chart
The RFM dashboard is populated with colored tiles. Each tile represents a different micro-segment, and a tile gets darker in shade the greater the percentage of the total profiles that the tile represents.
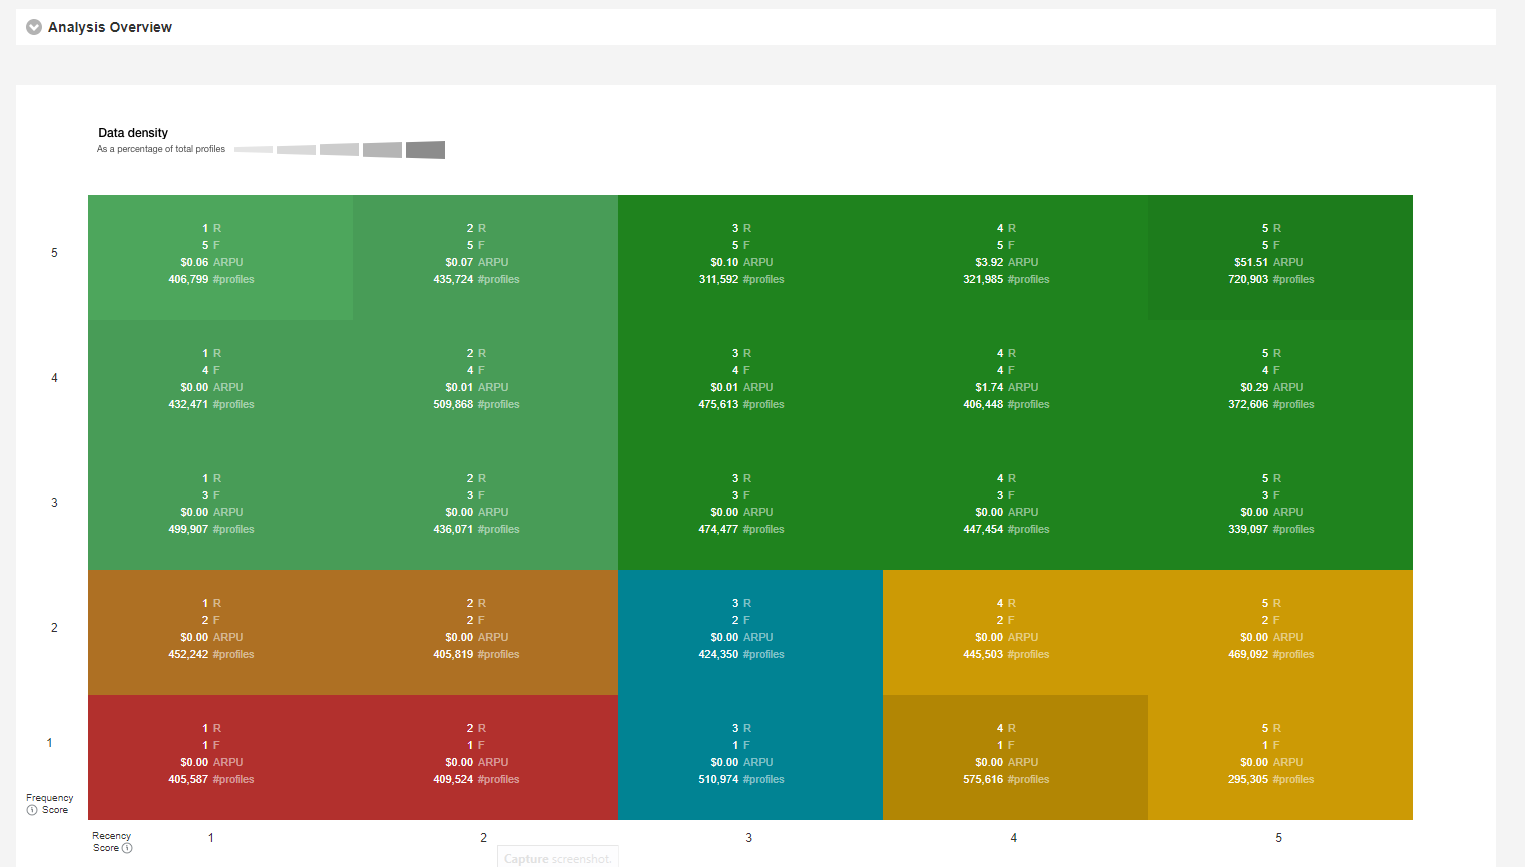
Each colored micro-segment tile in the RFM dashboard displays the following data:
- #profiles: The #profiles is the total amount of Mobile App Users used to calculate this micro-segment's data.
- ARPU: The Average Revenue Per User (ARPU) is the micro-segment's total order value associated with push campaigns divided by the number of profiles in the micro-segment. This metric/data is only available for the Push Campaign Engagement Recency and Frequency Event.
-
R Score: The Recency Score for a profile for each Use Case is calculated as follows:
-
Push Engagement: Leveraging a weighted combination of the profile's open and conversion recency on push campaigns.
-
In-app Engagement: Leveraging a weighted combination of the profile’s open and click recency for in-app campaigns.
-
Message Center Engagement: Leveraging a weighted combination of the profile’s display, open, and click recency on message center messages.
-
-
F Score: The Frequency Scorefor a profile for each Use Case is calculated as follows:
-
Push Engagement: Leveraging a weighted combination of the profile's open and conversion recency on push campaigns.
-
In-app Engagement: Leveraging a weighted combination of the profile’s open and click recency for in-app campaigns.
-
Message Center Engagement: Leveraging a weighted combination of the profile’s display, open, and click recency on message center messages.
-
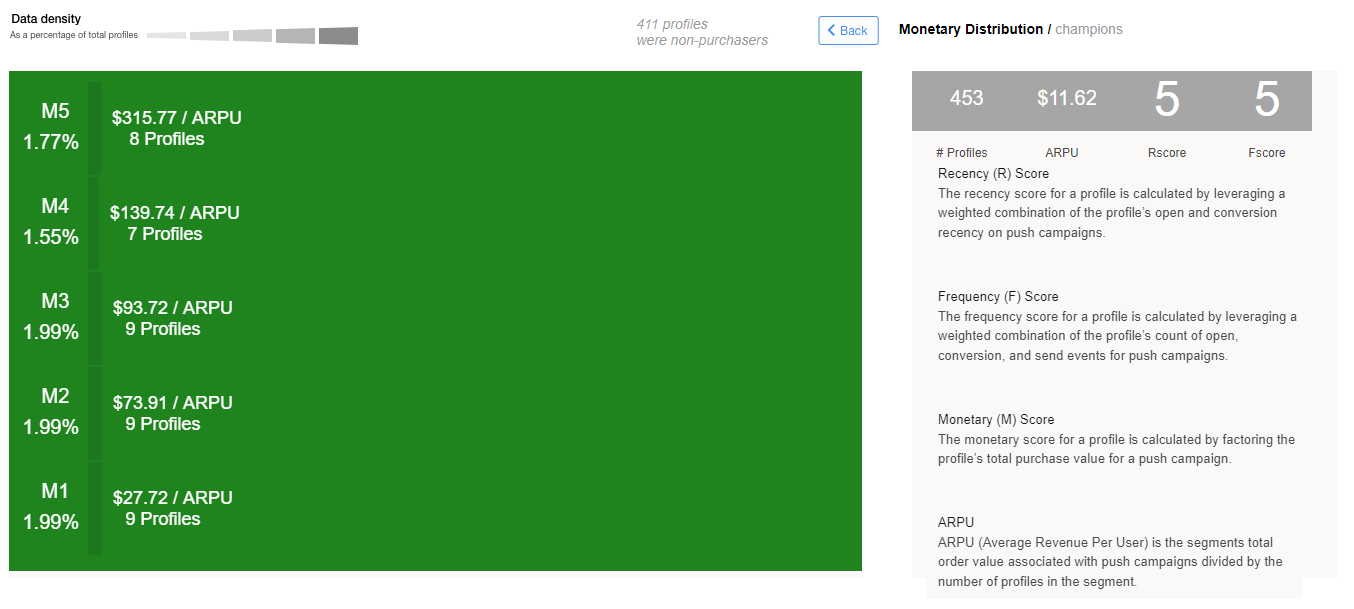
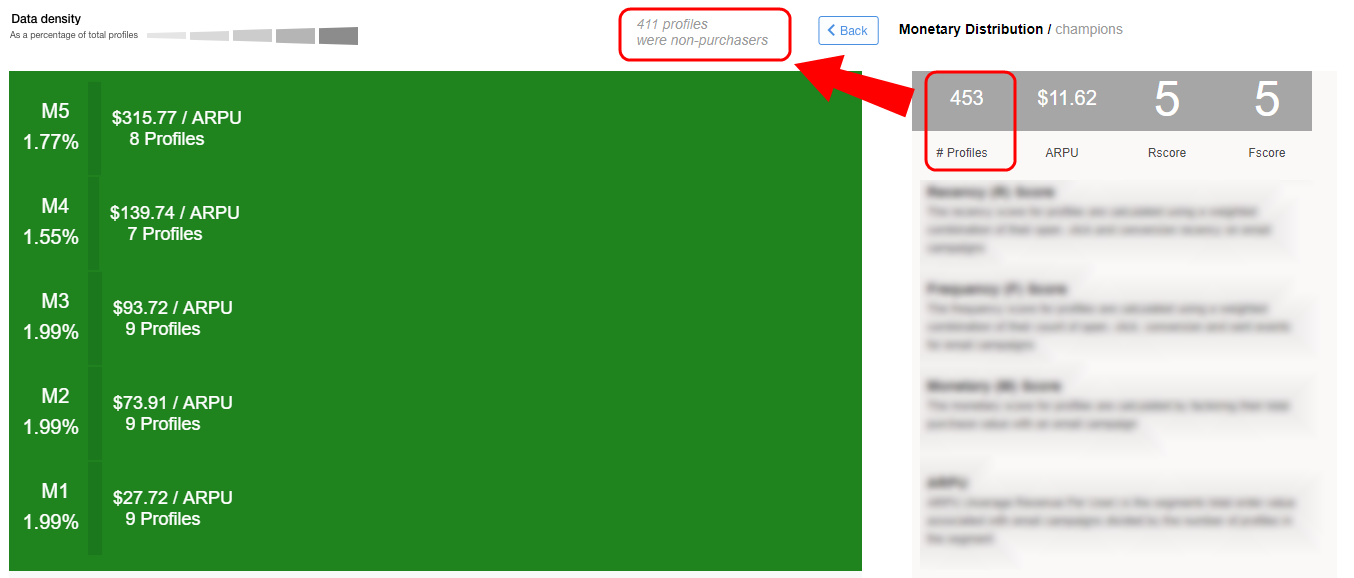
Monetary Distribution
The Monetary Distribution page displays the M Scores for a specific micro-segment. This analysis and data is only available for the Push Campaign Engagement Recency and Frequency Event.
M scores are based on revenue attributed to push campaigns (using the Push Purchase and Revenue Tracking Event provided by the Responsys mobile SDK). For each M Score, the chart provides its ARPU, profile count, and the percentage of the total profiles in the micro-segment that the M Score represents.
To navigate to the Monetary Distribution page for a micro-segment:
- On the RFM page, click on any colored tile in the RFM dashboard.
Recipients without revenue information
In some cases, recipients belonging to a micro-segment may have no revenue information, in which case they will be listed as non-purchasers on the Monetary Distribution page. These non-purchasers will not be included in the profiles used to calculate M scores. You can compare the number of non-purchases to the total number of profiles listed on the Monetary Distribution page.
There are a few different reasons a recipient may have no revenue information. These are:
- The recipient has not made a purchase. In this case, the specific recipient will have an M score of 0.
- You may not have conversion tracking enabled. In this case, your recipients will all have an M score of 0 and the ARPU values will all be at 0. Learn more about conversion tracking or Implementation and Validation of Campaign Engagement Events for Mobile Apps.
Configurations
Downloading data
Users have the ability to download aggregate RFM data in CSV file format from the RFM dashboard.
To download data from the dashboard:
- Click
 Download at the top of the page.
Changing the lookback timeframe
The look back window in RFM is the date range used when calculating and displaying RFM scores and personas for a particular list. The default look back window is the last 90 days. When you change the look back window, the new RFM scores and personas will be available in the next weekly RFM run. Changes to the look back window apply to all lists on the account.
To change the dashboard's lookback timeframe:
- Click
 Look Back Window at the top of the page.
 - Select a new timeframe.