Examples of Calculated Measures
The following examples show how you can use calculated measures in your pivot tables and charts.
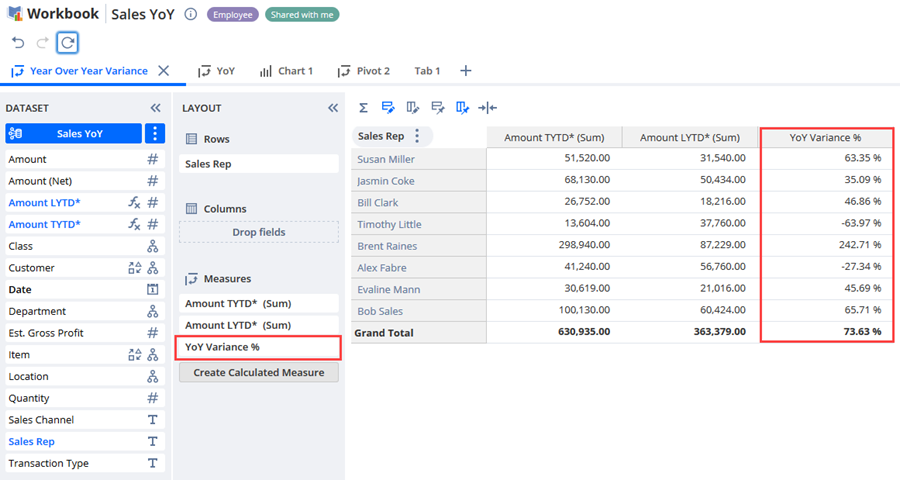
Year over Year Growth
You can create a calculated measure to compare year-over-year differences in your sales reps' performance. Here's how you can create a pivot table with a calculated measure that shows this difference.
|
Step |
Description |
|---|---|
|
Step 1: Create two formula fields using the Sales (Ordered) dataset |
To calculate year-over-year variance, you'll need to split the sales amount into two fields in the dataset. You can create these two formula fields:
To copy and paste the formulas, see Calculating Amounts for Relative Date Ranges. |
|
Step 2: Create your pivot table |
Set the following fields in the Layout panel:
For information about how to create pivot tables, see Workbook Pivot Tables. |
|
Step 3: Create your calculated measure |
Use the following definition:
For information about how to create calculated measures, see Working with Calculated Measures. |
|
Step 4: Format the results |
You can also customize your pivot table results, add totals and grand totals, or set the decimal values to percentage values. For more information, see Pivot Table Customization. |
After you create the calculated measure, the pivot table displays the difference over time.
For more information about comparing sales amounts over time using calculated measures, see the following video: