Statistics/KPI's - Projected Sales Data - Daily
You can enter in custom forecasted sales data to schedule shifts or if you have a POS integrations setup, you can use historical sales and units information to automatically generate an accurate forecast.
To view or adjust your forecast for the week, click Edit Forecast from the top menu bar.
From here, you have three options for generating a forecast:
-
Use POS defaults
If you have a POS integration setup, these will be the default settings that are applied to the stats. Update your default settings by going to Setup > Locations > select location > Scheduling > Default stats
-
Use custom POS settings
If you have a POS integration setup, you can use the date selector to choose which week of data you want to use to build your forecast. You can also choose to apply a rolling average and/or an index.
-
Use an entered projection
If you don't have a POS integration setup, you can manually enter the forecasted sales and units by day or by the week. If you enter a weekly total, you can then use percentages to distribute the sales and units appropriately throughout the week.
When you've chosen your forecast method, click Generate forecast for week.
When it generates, you'll see the forecasted sales and/or units for the future week you've selected. You can drill into the individual days and fine tune the forecast by clicking the gray edit pencil next to the day you want to adjust.
If you want to adjust a certain time of the day, you can click expand to expand out the day and fine tune it further.
When you're happy with your forecast, scroll back to the top and click Create schedule to be taken back to the daily view for this location to build your schedule.
On the right-hand side of the screen, you'll see a statistics panel. The top of this panel displays your total projected labor cost percentage for the week. The next set of data contains your wage data. You'll have the total costs for the day and the week. If any on-costs are set up, you'll see them underneath the base wage cost.
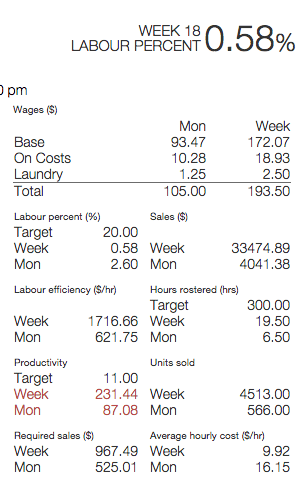
The statistics in the KPI panel represent:
-
Wages: The total cost of wages. Base shows the raw cost of wages, while any modifiers set up for your location will be individually listed and included in the total wage figure.
-
Sales: Forecasted sales based on actual sales figures.
-
Units: Forecasted units based on actual units figures. Units can represent different figures depending on your POS, but often represent the number of transactions or individual items sold.
-
Hours Schedule: The total number of hours scheduled.
-
Labor percent: The percentage of how much of your projected sales are going toward the projected wages, ie: labor as a percent of sales.
-
Labor efficiency: The sales per labor hour.
-
Productivity: The units per labor hour.
-
Required sales: How much you'll need to make in sales to meet your labor percent target, based on your wage cost.
-
Average hourly cost: The total wages divided by the number of hours.