Table View Portlets
You can see your table view data on your home dashboard by adding the Analytics portlet. This lets you quickly see workbook data and jump right into your workbook. Seeing data right on your dashboard means you'll spend more time learning from it and less time tracking it down.
You can pick how you want to see your table view portlet by setting how many rows show at one time. You can also give the Analytics portlet a custom title, by default it shows the workbook and pivot table names. Conditional formatting from your table views appears in the portlet, too. For more information, see Conditional Formatting.
In your table view portlets, you can do the following:
-
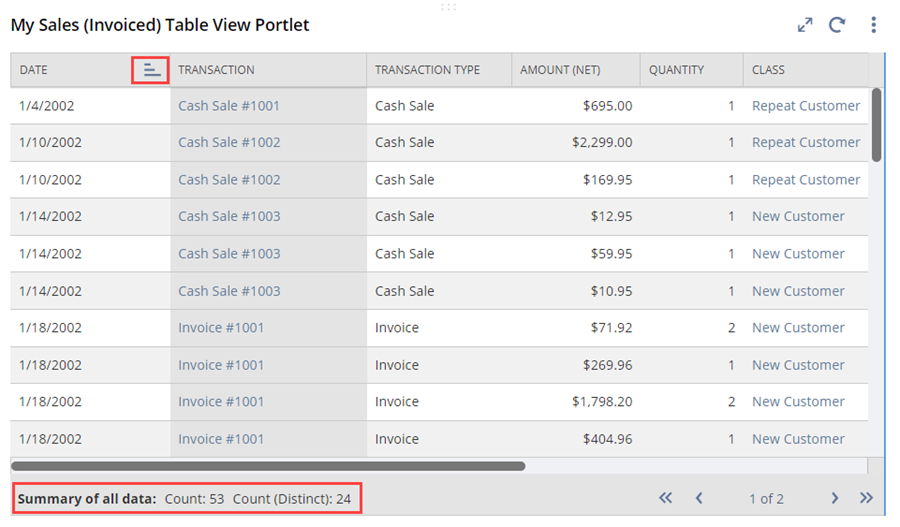
View the column summary - When you pick a column in your table view, you can also see a summary of results in the table footer. What's shown depends on the field type and could include the count, count (distinct), average, and more.
-
Sort and filter your results - You get the same sorting and filtering options as you have in your workbook table view.
As with charts and pivot tables, you can get to your workbooks through table view portlets.
For more information about how to add and set up the Analytics portlet, see Workbooks.