Workbooks
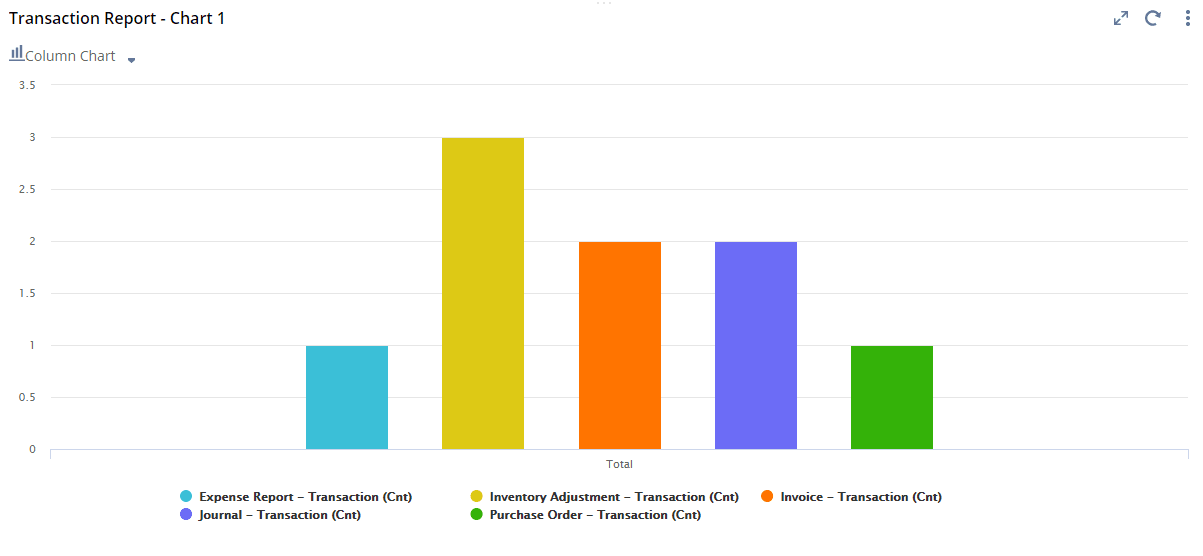
The Analytics portlet lets you view your workbook charts, pivot tables, and table views on your dashboard. You can add up to 10 Analytics portlets, with each one displaying a single visualization. You can pick any visualization from your account, including any workbooks you've saved or that have been shared with you.
You can set layout options for each portlet. For charts, set the portlet size and chart type. For pivot tables and table views, set the height by choosing how many rows you want visible. These settings only apply to that portlet.
In pivot tables, the rows displayed include both header and result rows. In table views, only result rows count toward the displayed number. For more information, see Setting Up the Analytics Portlet.
You can also open workbooks through the portlet. If you don't own a workbook but have the Analytics Administrator permission, you can view, edit, and delete workbooks created by other users in your account. For more information about the Analytics Administrator, see The Analytics Administrator Permission.
To set up the Analytics Portlet on your dashboard, the SuiteAnalytics Workbook feature must be enabled. The feature is enabled by default. For more information see Enabling SuiteAnalytics Workbook in Your NetSuite Account.

You can also apply filters to your Analytics portlet. For more information about data visualization in your portlet, see Viewing Workbook Data in the Analytics Portlet.
For more information about Analytics portlets, see the following topics: