Setting Up the Analytics Portlet
After you add an Analytics portlet to your dashboard, click the Set Up option in the upper right corner. There you can choose the visualization you want to see. You can select a different chart, pivot table, or table view per portlet.
To set up the Analytics Portlet:
-
Click Set Up in your Analytics Portlet.
-
In the Analytics popup, pick the visualization you want by clicking an option from the list of available visualizations:
-
Pivot tables

-
Charts

-
Table views

Optionally, you can use one of the following options to identify the chart or pivot table:
-
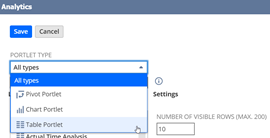
From the Portlet type drop-down list, filter by charts, pivot tables, or table views by selecting one of the portlet types.
-
In the Search field, enter part of the name of the workbook visualization that you want to view.
Note:You'll see your workbook visualizations and any that have been shared with you.
-
-
After you pick a workbook visualization, the Settings options are displayed on the right.
-
In the Settings panel, you can do the following:
-
For charts, pivot tables, and table views, enter a title for the portlet in the Custom name field. If you leave it empty, the portlet shows the workbook and visualization name.
Note:If your workbook visualization has a name in the translatable Default Portlet Title field, don't enter a name in the Custom name field. The Custom name field replaces the translatable field name and translations won't be available. For more information, see Adding Translatable Analytics Portlet Names.
-
For charts, select the size of the portlet. Available sizes are Short, Medium, and Tall.
-
For pivot tables, enter how many rows you want visible in the portlet. The portlet height will automatically adjust to fit that number.
Note:The number of rows shown includes both header and result rows. For example, if your pivot table has two header rows and you want five result rows, enter 7 in the Number of visible rows field. By default, the portlet displays 10 rows.
-
For table views, enter how many rows you want visible in the portlet. The height automatically adjusts to fit that number.
Note:The number of rows is only result rows. For example, if you enter 5 for Number of visible rows, your table view displays the header, five result rows, and the footer row. By default, the portlet displays 10 result rows.
-
-
Click Save.
The workbook visualization appears in the portlet.