Key Performance Indicators Portlet
Key performance indicators (KPIs) help you quickly check the project status and make fast decisions to ensure the project stays within the budget and schedule.
The Key Performance Indicators portlet displays the following gauge charts:
The following screenshot shows the Key Performance Indicators portlet and its KPI gauge charts:
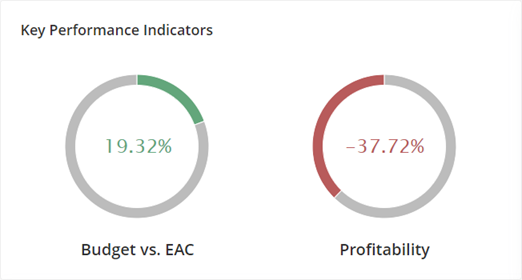
Budget vs. EAC KPI
The Budget and Estimate at Completion (EAC) gauge chart provides a visual comparison of the baseline budget and the estimated cost of the project upon completion. The project variance in percentage is shown inside the gauge chart.
To calculate the margin or profit percentage, the system uses the following formula then converts the result into a percentage value:
|
Variance = (baseline budget - EAC) / baseline budget |
The chart's fill color changes based on the following scenarios:
|
Color |
Description |
|---|---|
|
Gray |
There is no project budget or EAC value and an em dash is shown in the gauge chart. |
|
Green |
The variance is more than 10% of the baseline budget and fills the chart in a clockwise direction. The chart retains the green fill color if the project profitability goes beyond 100%. |
|
Amber |
The variance is within 10% of the baseline budget. |
|
Red |
The variance is less than or equal to zero, or the EAC budget is greater than the baseline budget. Unlike green and amber chart colors, red fills the chart in a counterclockwise direction. |
When you hover over the gauge chart, you'll see one of these tooltips:
-
On the green, amber, or red section of the chart, the tooltip displays the variance in percentage value.
-
On the gray or remaining section of the chart, the tooltip displays both the baseline budget and the EAC budget.
-
If the entire gauge chart has one color, either gray, green, or red, the tooltip displays both the baseline and EAC budgets, and the variance.
Profitability KPI
The Profitability gauge chart visually represents your project's financial profits. Profitability is determined by comparing the costs to complete the deliverable against the revenue generated as the project progresses.
When you hover over the gauge chart, you'll see the calculated profit percentage in the tooltip. This value matches the overall project margin shown on the Project Profitability portlet.
To calculate the margin or profit percentage, the system uses the following formula:
|
Margin = (Revenue - Cost) * 100 / Revenue |
The chart fill color changes depending on the following scenarios:
|
Color |
Description |
|---|---|
|
Gray |
The margin is 0%. This color also means there is no project profitability data to show and an em dash is also shown in the gauge chart. |
|
Green |
The profitability is more than 0%. The chart retains the green fill color if the profitability is more than 100%. |
|
Red |
The profitability is less than 0%. |