Client Invoices Portlet
The Client Invoices portlet shows the graph representation of the monthly client invoices generated for the project.
The following screenshot shows the Client Invoices portlet with the bar and line graphs for cumulative and monthly amounts:
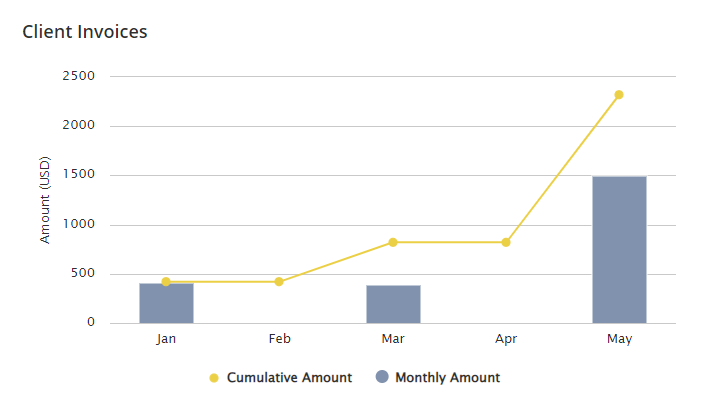
The calendar months are shown in the x-axis and the invoice amount range is shown in the y-axis.
The portlet uses two graph types to represent two datasets:
-
Cumulative Amount - The line graph represents the cumulative amount of invoices.
-
Monthly Amount - The bar graph represents invoice amounts generated monthly.
You can hover to each bar graph or line graph to see the corresponding invoice amount.