Measure-based Filters
In pivot tables, measure-based filters let you filter out entire columns or rows using conditions applied to the totals shown, based on the measures defined for the table. In charts, any columns, bars, or lines with total values that don't meet the selected criteria are removed from the chart.
For example, say you've set up a pivot table and want to see only customers with over thirty thousand dollars in total transactions:
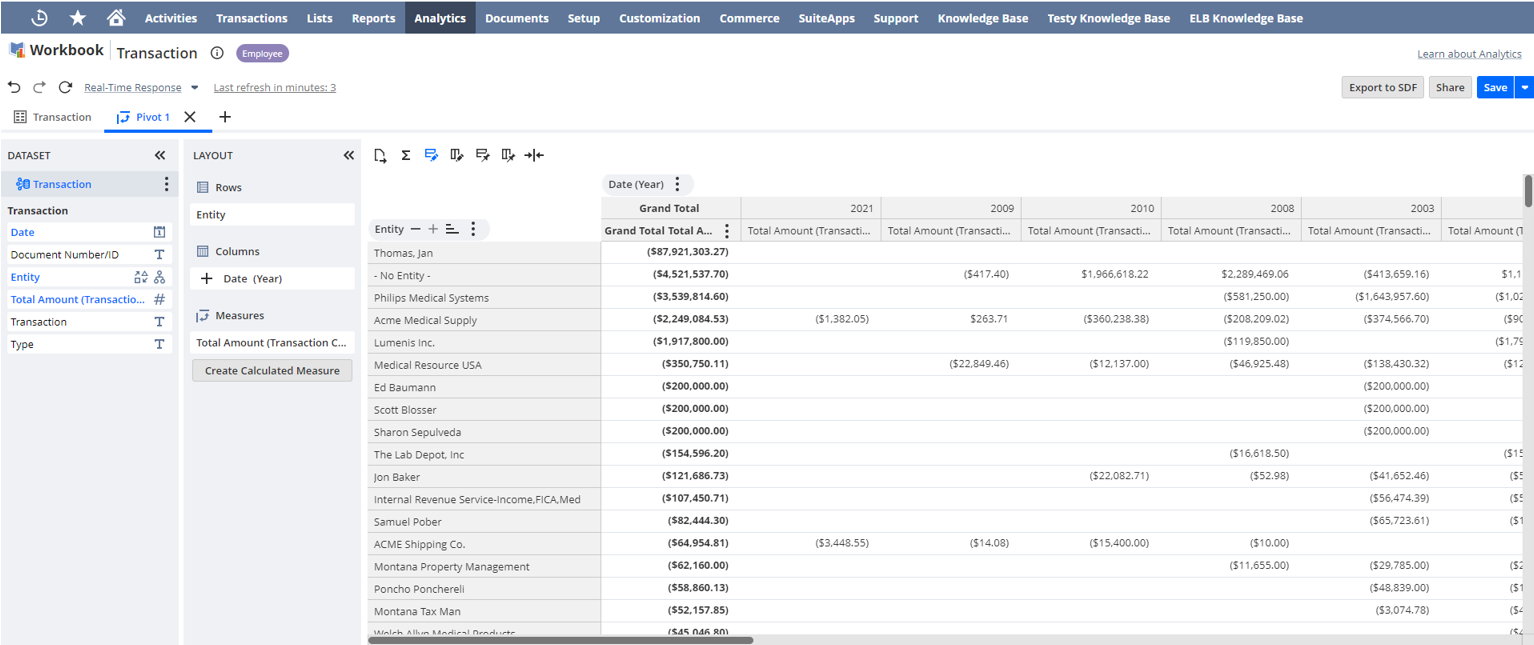
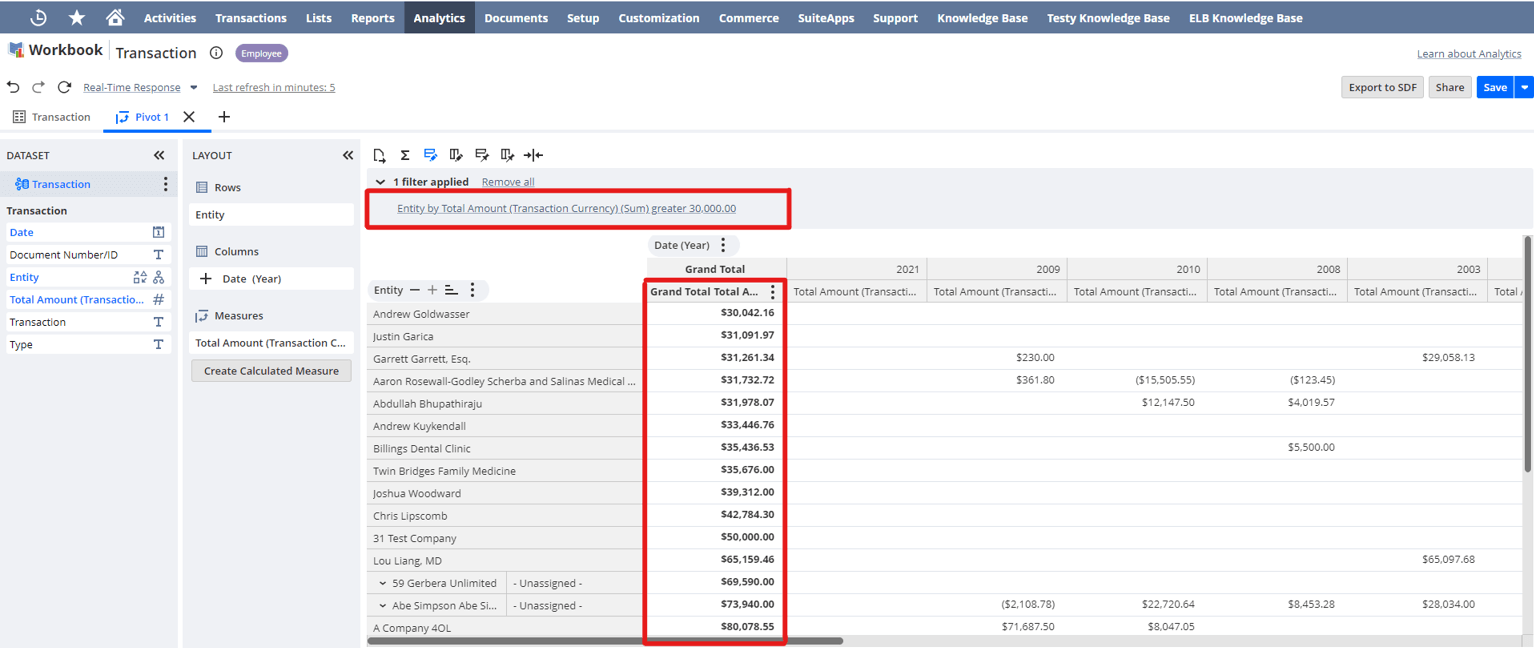
To do this, you can apply a measure-based filter to the entity field, like Entity by Total Amount (Transaction Currency) (Sum) greater 30,000.00.
You can also use a measure-based filter on a dimension to show the top or bottom items you want, for example, Entity by Total Amount (Transaction Currency) (Sum) TOP 10.
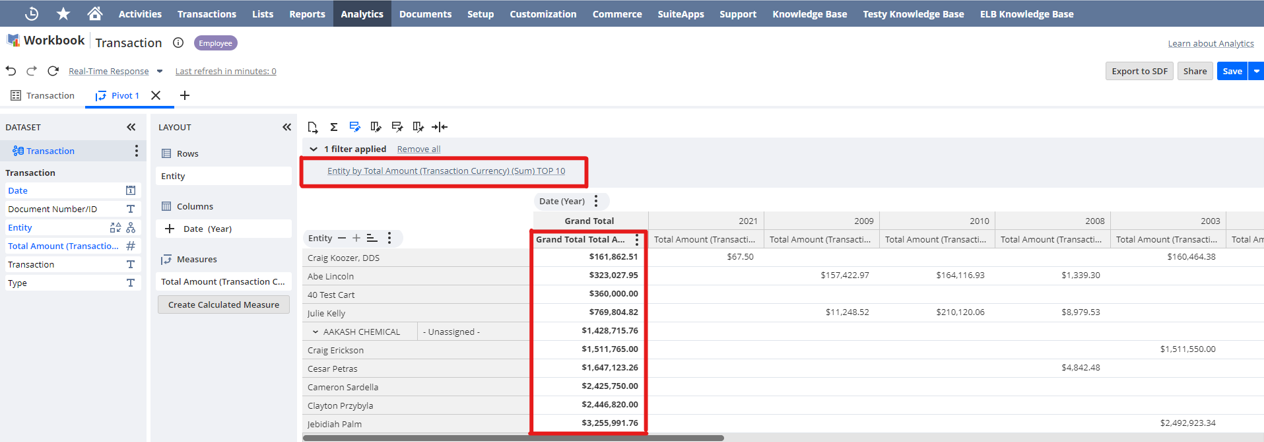
In both cases, you apply a filter to the Entity rows based on their total amount (transaction currency) totals.
If you're in a NetSuite account with values in multiple currencies, or a NetSuite OneWorld account with multiple subsidiaries, you need to convert or consolidate these values before you can use them in a measure-based filter condition. For more information about currency conversion in SuiteAnalytics Workbook, see Currency in Datasets and Workbooks.
Measure-based filters are available in measure fields (also called aggregate fields), and only apply to charts and pivot tables. You can apply measure-based filters from either a dimension or a measure field.
To apply a measure-based filter to your pivot table or chart from a dimension field:
-
Click the Field Menu icon
 next to a dimension field in the Layout panel or Viewer.
 -
Select Filter Top/Bottom.
The Filter window appears.
-
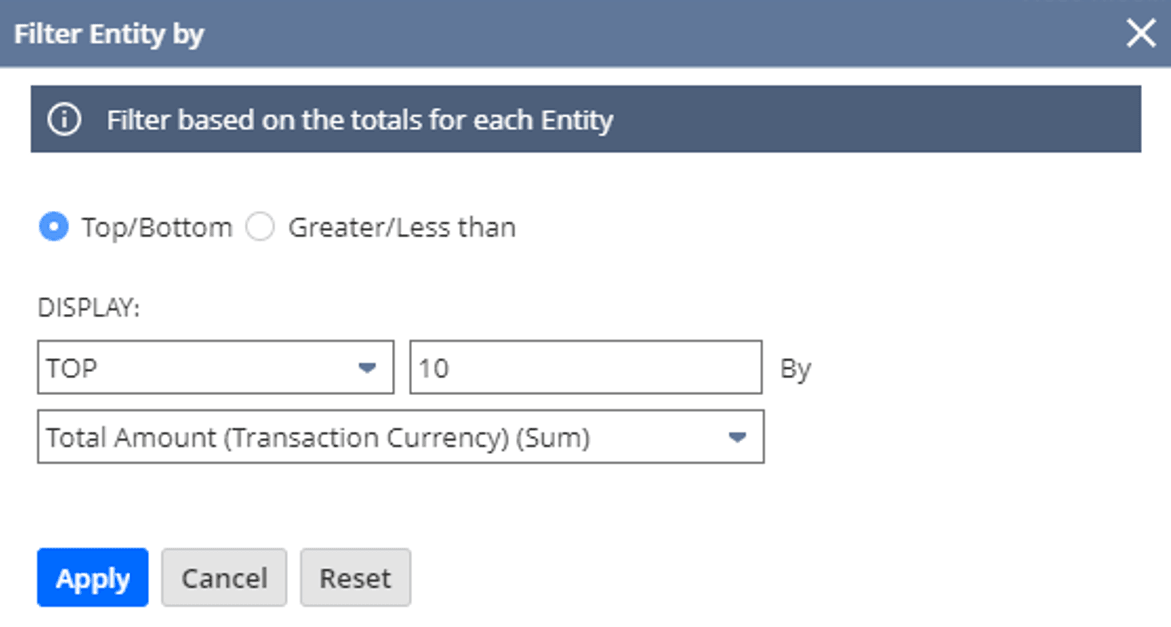
In the Filter window, select Top/Bottom (default option) or Greater/Less than, then select the measure and set the conditions for the filter.
-
Click Apply.
The table or chart automatically updates the results.
To apply a measure-based filter to your pivot table or chart from a measure field:
-
Click the Field Menu icon
next to a measure field in the Layout panel. In pivot tables, you can also access the filter by clicking the Field Menu icon next to the Grand Total field in the Viewer, or from any measure column if there are no dimension fields displayed in the columns section. -
Select Filter by and click a dimension.
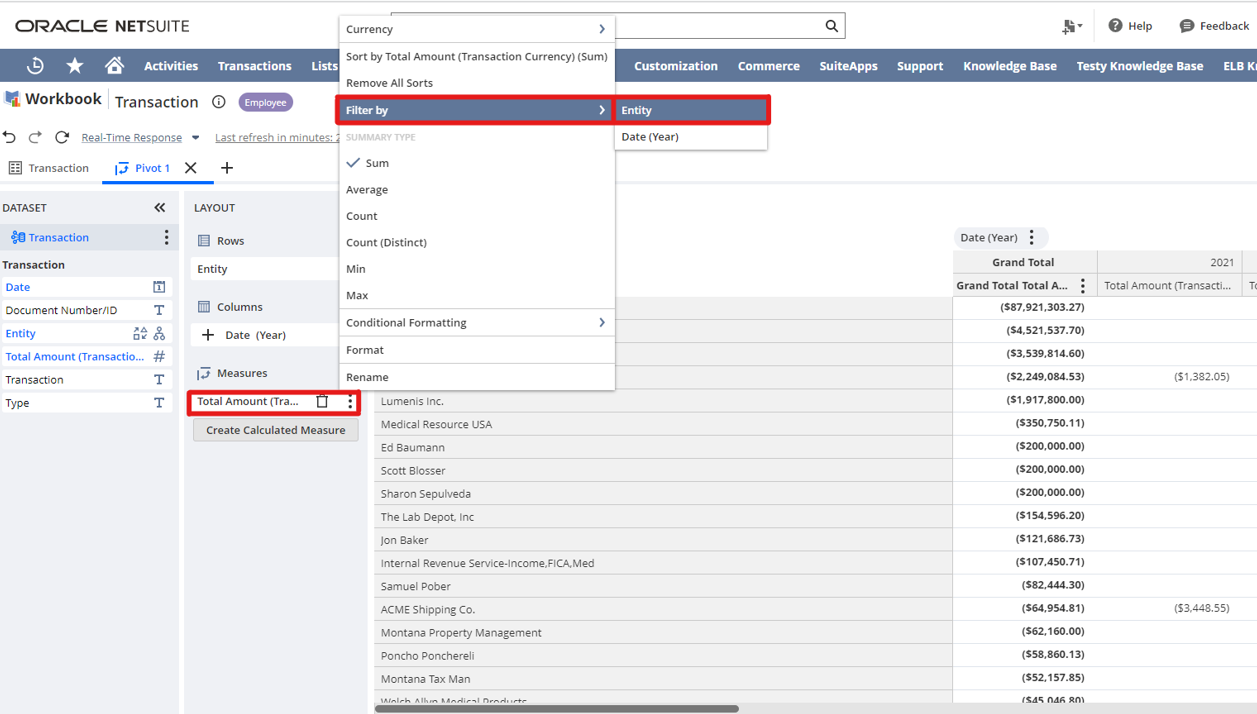
The filter window appears.
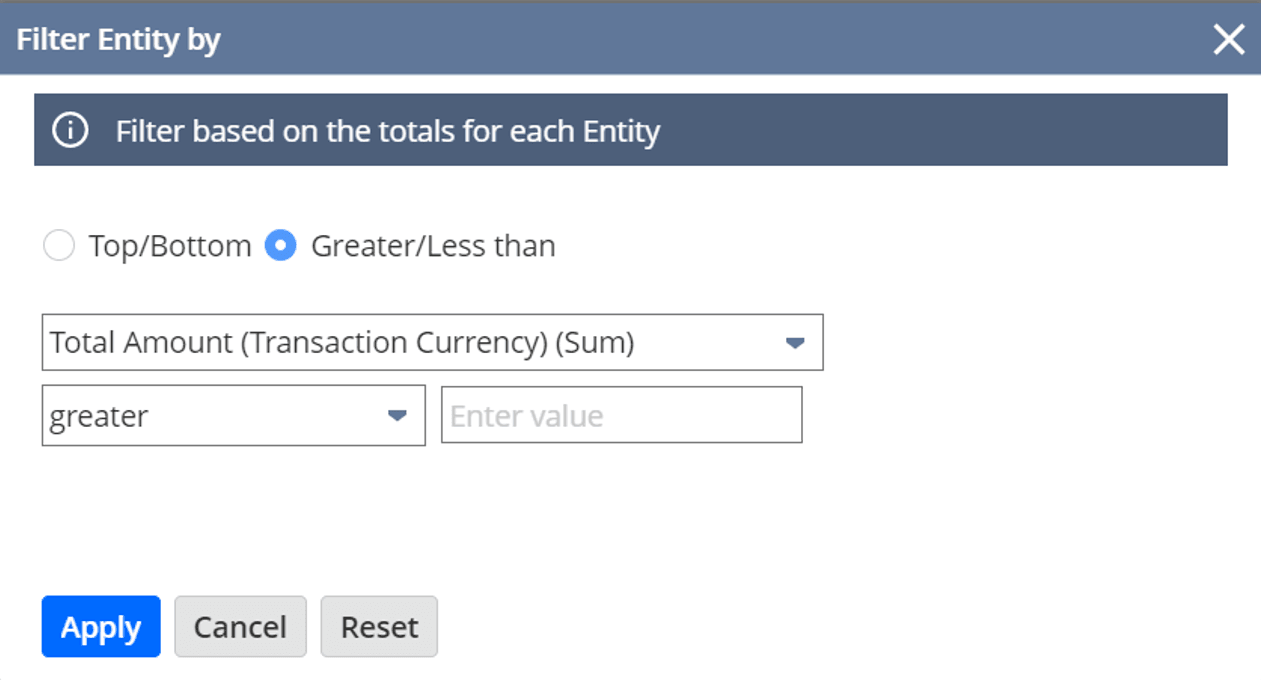
-
In the Filter window, select Greater/Less than (default option) or Top/Bottom, then select the measure and set the conditions for the filter.
-
Click Apply.
The table or chart automatically updates the results.