Workbook Visualization Filters
After you set up a table view, pivot table, or chart, you can filter the data using a few types of filters: value-based, condition-based, measure-based, or date filters.
In table views and pivot tables, value-based filters check every row and column and remove those that don't have your selected value. In charts, any columns, bars, or lines that don't have the value you picked are removed too.
In pivot tables, measure-based filters check row and column totals and remove anything that doesn't match your filter. In charts, columns, bars, or lines with totals that don't meet your filter are removed. You can use measure-based filters on measure fields (ones that need sum, count, average, etc.), so they're only for charts and pivot tables.
In any visualization, you can make filters based on dates or conditions. For date fields, filter using specific or dynamic dates. For number fields, you can add condition-based filters for any range of numbers.
You can add as many value-based filters as you want to a visualization, but only one measure-based or date filter. If you use both, value-based filters are always applied first.
Filters you add to a visualization only affect what you see in that visualization, they don't change the dataset it's using. To filter the dataset, make criteria filters in the Dataset Builder. Also, if your NetSuite account has values in different currencies or is a OneWorld account with multiple subsidiaries, you'll need to convert or consolidate those values before you can use them in a measure-based filter.
For more information about filtering a dataset, see Dataset Criteria Filters.
If you are working in a visualization based on linked datasets, you must apply dataset criteria filters to the matching field in each dataset. If you do not, your results might include values that you wanted to filter. For more information, see Create Visualizations Based on Linked Datasets.
For more information converting or consolidating values in a workbook visualization, see Currency in Datasets and Workbooks.
To learn how to use the workbook visualization filters, see the following:
Available Filters for Aggregate and Non-Aggregate Fields
When you're working with filters, each field shows different options based on the type of field you pick (like numeric or date fields) and how you use them in your workbook visualizations. In charts and pivot tables, you can use some fields in two different ways:
-
Use fields as aggregate fields - If you drag fields to the Measure section, the visualization shows results as an aggregate field. Therefore, results are grouped together to display a single summary result for several value entries.
-
Use fields as non-aggregate fields - If you drag fields to the Rows or Columns sections (for pivot tables) or the X-Axis and Color Stack sections (for charts), each aggregate field shows a result for each value entry.
Whether you use fields as aggregate or non-aggregate values affects how your workbook visualizations show results. For example, if you want to see the sales amount broken by sales rep, your workbook visualization can display results in different ways. If you use the Amount (Net) field as an aggregate (or measure) field, the visualization shows a single result for all sales transactions by a specific sales rep, based on the aggregate function you choose. For example, if you pick the sum function, you'll see a single value for all the sales transactions. In this case, the field displays 10,000 USD. If you use the Amount (Net) field as a non-aggregate field, the visualization shows a result for each sales transaction of that sales rep. In this case, the visualization displays the following field results: transaction A (9,000 USD), transaction B (600 USD), and transaction C (400 USD).
Value-based Filters
Value-based filters let you filter the data in your workbook visualizations using specific values from any field you've added to the Layout panel or Table Viewer. In pivot tables, value-based filters apply to every row and column, and remove any that don't contain the selected value. In charts, any columns, bars, or lines that don't contain the selected value are removed from the results.
To apply a value-based filter to a workbook visualization:
-
Click the Field Menu icon
 next to any field in the Layout panel or Viewer and select Filter [Field Name]...
The Filter window appears.
-
In the Filter window, select the field values and operator to use in the filter condition.
-
(Optional) In the search box, you can enter the value you're looking for.
-
Click OK.
The results update, and the selected filter criteria shows above the Viewer.
Condition-based Filters
You can use condition-based filters on numeric fields to show results that match a specific numeric range. To do this, you can pick the operator you want to use (like greater than, equal to, and so on), then enter the numeric value. For example, you can see opportunity amounts by sales rep, and show only results with a won probability above 80%. To see these results in your workbook visualization, you can add a condition-based filter to the probability (%) field, and set it to "greater" and "80%".
This option is available for percentage, integer and float fields that do not return currency values. If you want to use this option on currency fields, customize your field by using a TO_NUMBER formula function and changing the field's output type. For more information about how to customize a currency field, see Advanced Sample Formula Fields.
To apply a condition-based filter to a workbook visualization:
-
Click the Field Menu icon
 next to a field label and select Filter [Field Name]...
The Filter window appears.
-
In the Filter window, select the operator you want to use, then enter the numeric value.
-
Click OK.
The results update, and the selected filter criteria shows above the Viewer.
Measure-based Filters
In pivot tables, measure-based filters let you filter out entire columns or rows using conditions applied to the totals shown, based on the measures defined for the table. In charts, any columns, bars, or lines with total values that don't meet the selected criteria are removed from the chart.
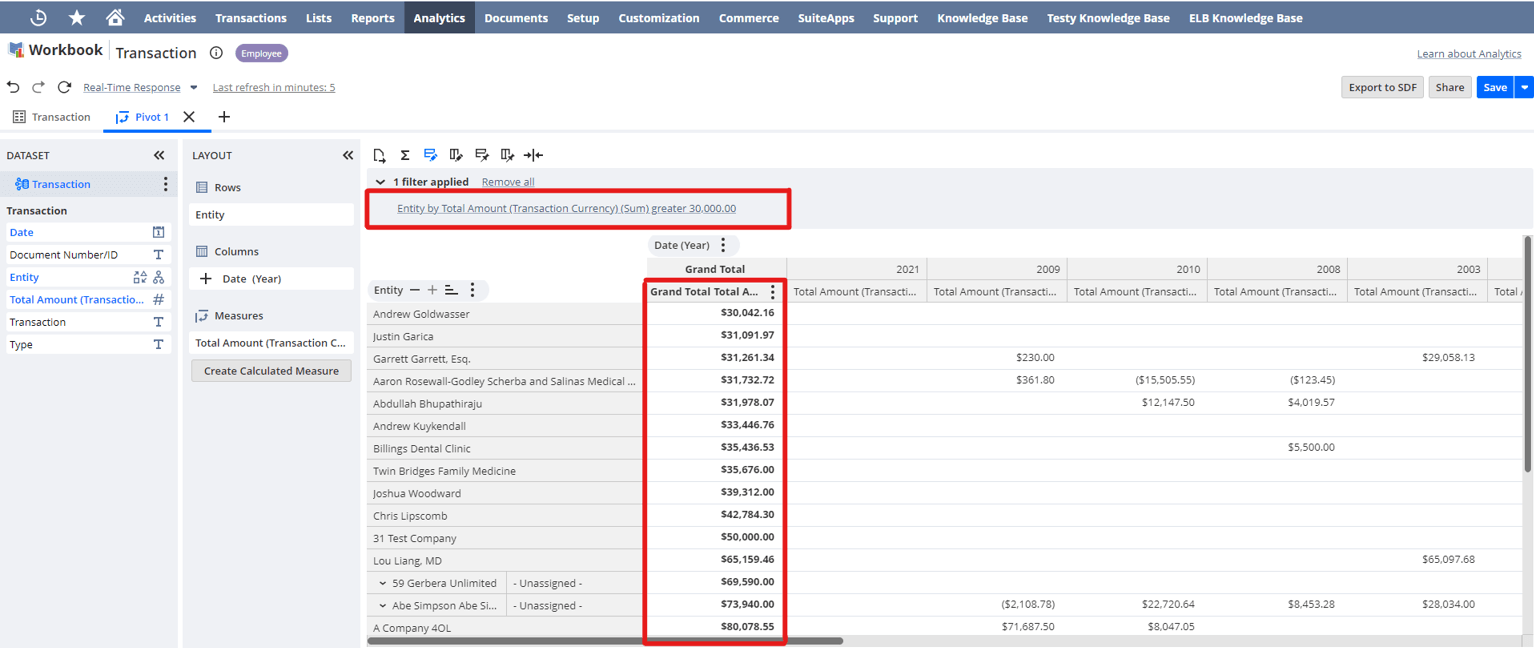
For example, say you've set up a pivot table and want to see only customers with over thirty thousand dollars in total transactions:
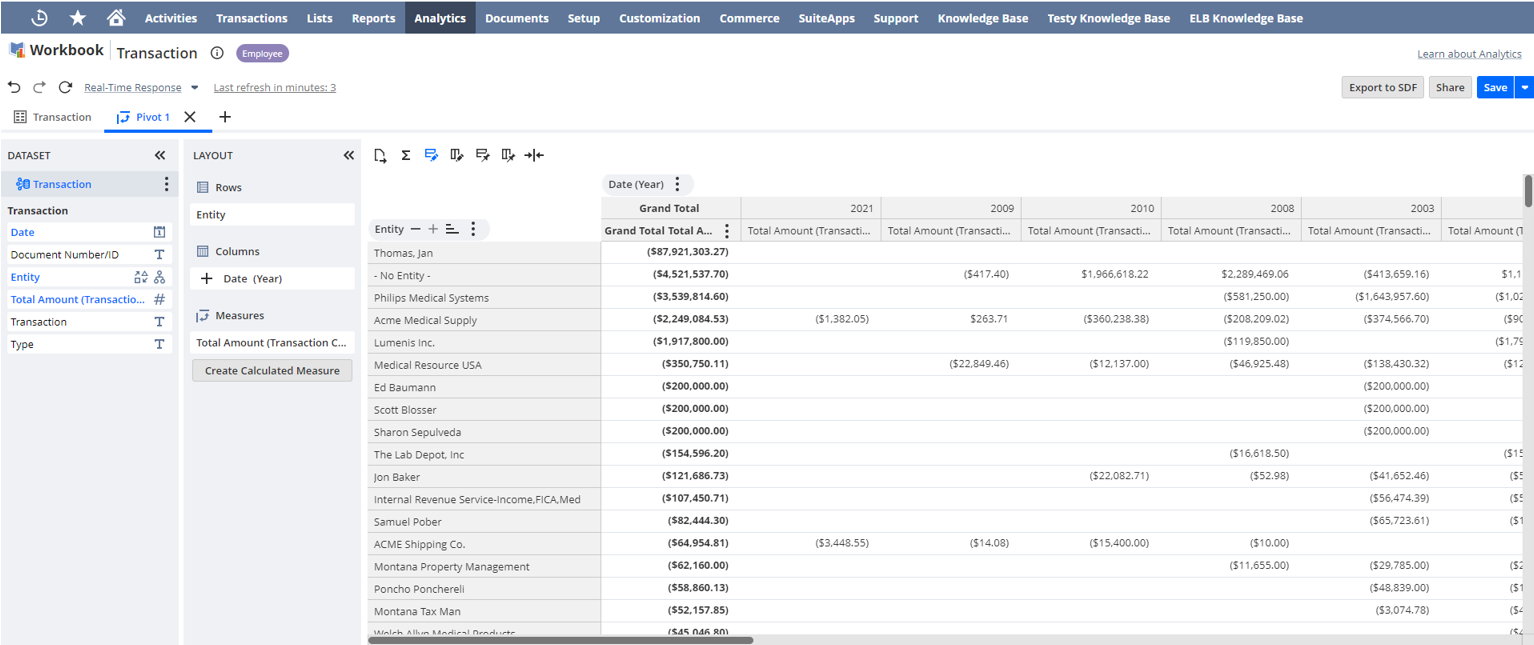
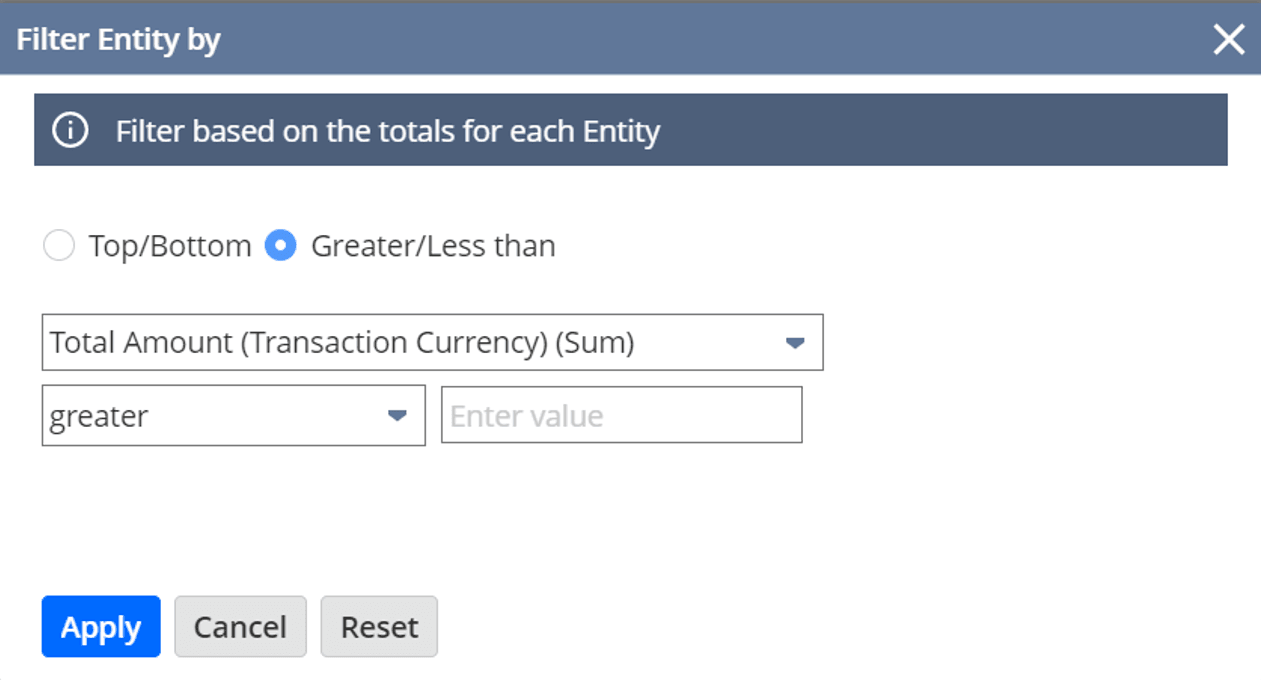
To do this, you can apply a measure-based filter to the entity field, like Entity by Total Amount (Transaction Currency) (Sum) greater 30,000.00.
You can also use a measure-based filter on a dimension to show the top or bottom items you want, for example, Entity by Total Amount (Transaction Currency) (Sum) TOP 10.
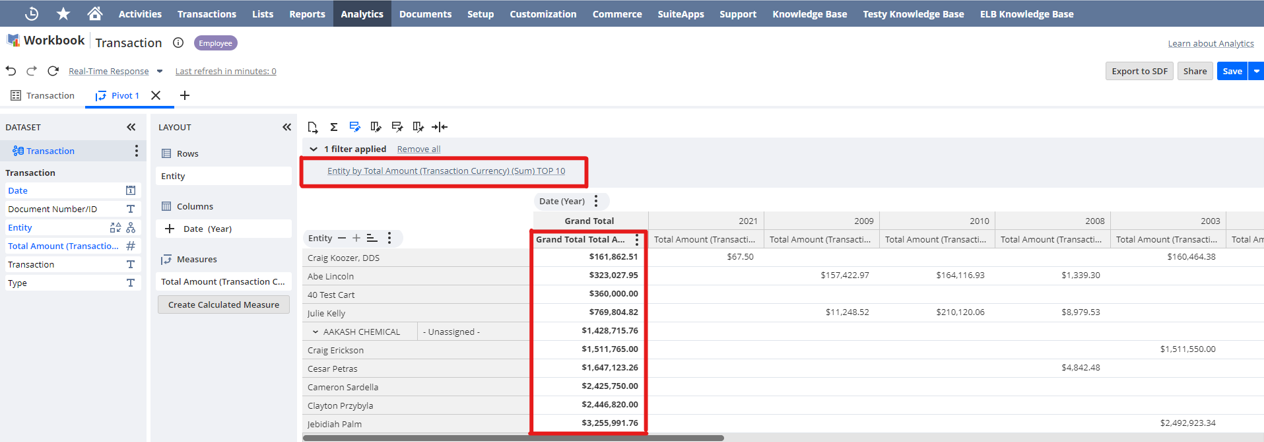
In both cases, you apply a filter to the Entity rows based on their total amount (transaction currency) totals.
If you're in a NetSuite account with values in multiple currencies, or a NetSuite OneWorld account with multiple subsidiaries, you need to convert or consolidate these values before you can use them in a measure-based filter condition. For more information about currency conversion in SuiteAnalytics Workbook, see Currency in Datasets and Workbooks.
Measure-based filters are available in measure fields (also called aggregate fields), and only apply to charts and pivot tables. You can apply measure-based filters from either a dimension or a measure field.
To apply a measure-based filter to your pivot table or chart from a dimension field:
-
Click the Field Menu icon
 next to a dimension field in the Layout panel or Viewer.
 -
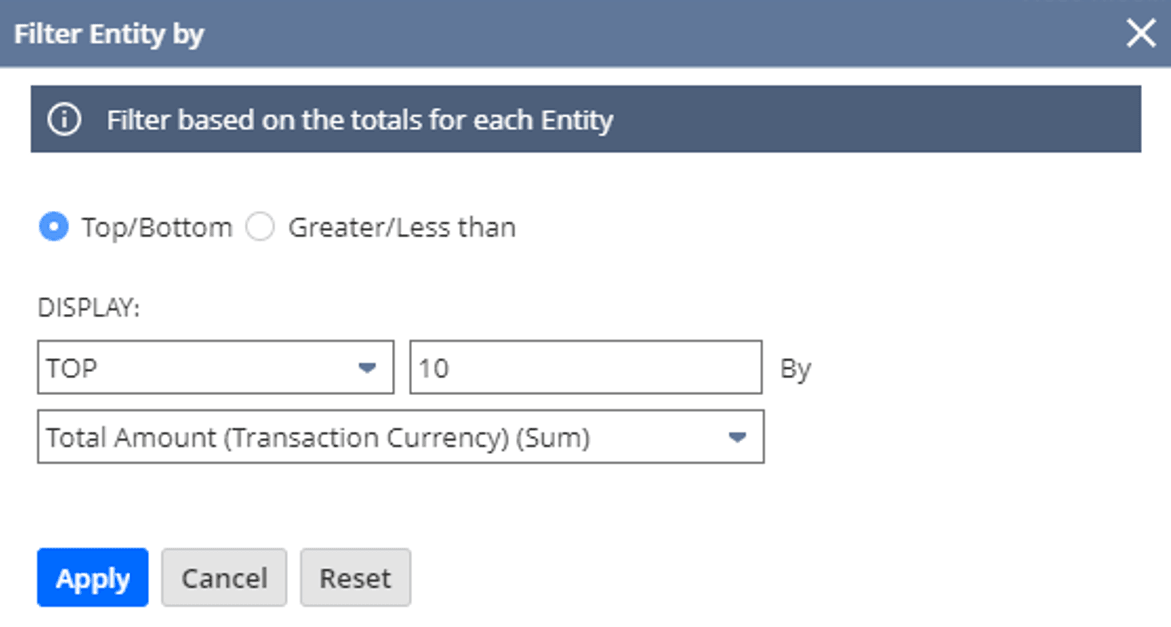
Select Filter Top/Bottom.
The Filter window appears.
-
In the Filter window, select Top/Bottom (default option) or Greater/Less than, then select the measure and set the conditions for the filter.
-
Click Apply.
The table or chart automatically updates the results.
To apply a measure-based filter to your pivot table or chart from a measure field:
-
Click the Field Menu icon
 next to a measure field in the Layout panel. In pivot tables, you can also access the filter by clicking the Field Menu icon
  next to the Grand Total field in the Viewer, or from any measure column if there are no dimension fields displayed in the columns section.
 -
Select Filter by and click a dimension.
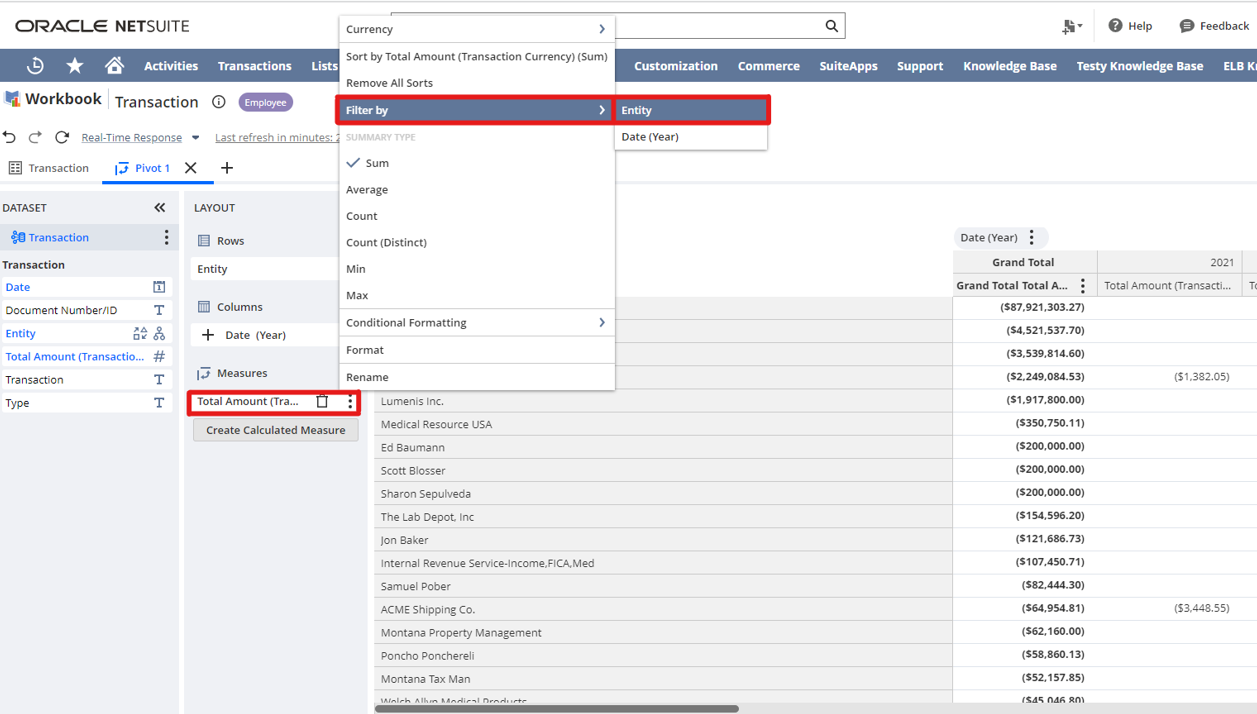
The filter window appears.
-
In the Filter window, select Greater/Less than (default option) or Top/Bottom, then select the measure and set the conditions for the filter.
-
Click Apply.
The table or chart automatically updates the results.
Date Filters
Date filters let you filter your results by a specific date, custom date, or dynamic date range you choose. For example, you can select a dynamic date like today, which updates when the workbook runs. You can only apply one date filter per workbook visualization.
Date filters are available in date fields and work with all workbook visualizations (charts, pivot tables, and table views).
To apply a date filter to a workbook visualization:
-
Click the Field Menu icon
 in the Dataset Panel or Layout Panel next to a date field and select Filter Date> Advanced...
 -
In the Filter Date (Advanced...) window, use the Specific Dates tab to enter a custom date or the Date Ranges tab to select a dynamic date. Use the Values tab to select specific dates from the underlying dataset query results.
-
Click Apply.
The workbook visualization automatically updates the results.
The results are updated and the selected filter criteria is displayed above the Viewer.