Chart-based Portlets
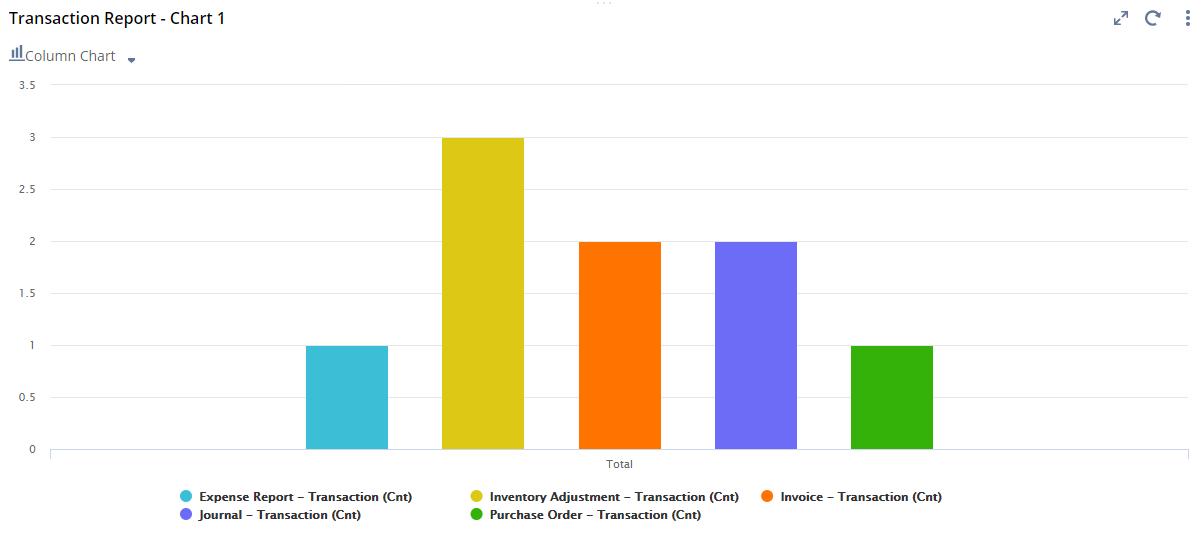
You can see your chart data on your home dashboard by adding the Analytics portlet. This lets you quickly view your chart and jump into your workbook. Having the data right on your dashboard means you'll spend more time learning from it and less time looking for it.
You can also pick how you want to see your chart by choosing layout options like portlet size and chart type. You can give the Analytics portlet a custom title. By default it shows the workbook and chart names.
For more information about how to add and set up the Analytics portlet, see Workbooks.