Load Profile
The Load Profile section of the report describes the load analyzed in the sampled session activity. Use the information in this section to identify the service, client, or SQL command type that may be the cause of the transient performance problem.
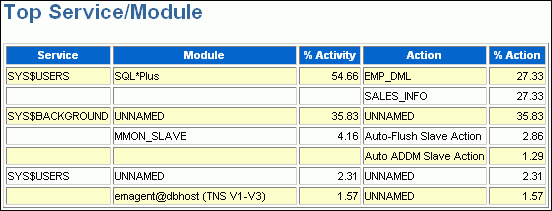
The Top Service/Module subsection lists the services and modules that accounted for the highest percentages of sampled session activity. A service is a group of related database tasks that share common functionality, quality expectations, and priority. Services are a convenient way to monitor multiple applications. The SYS$USERS and SYS$BACKGROUND services are always defined.
Figure 8-3 shows that over half of the database activity is consumed by the SYS$USERS service running the SQL*Plus module. In this example, it appears that the user is running high-load SQL that is causing the performance problem indicated in Figure 8-1. The Top SQL section of the report should be analyzed next to determine whether a particular type of SQL statement makes up the load.
See Also:
