12 Getting Started with the Client Tools
You can use multiple client tools to interact with the graph server (PGX) or directly with the graph data in the database.
The following sections explain how to use the various client tools:
- Interactive Graph Shell CLIs
Both the Oracle Graph server and client packages contain interactive command-line applications for interacting with the Java APIs and the Python APIs of the product, locally or on remote computers. - Using Autonomous Database Graph Client
Using theAdbGraphClientAPI, you can access Graph Studio features in Autonomous Database programmatically using the Oracle Graph Client or through your Java or Python application. - Using the Graph Visualization Web Client
You can use the Graph Visualization application to visualize graphs that are either loaded into the graph server (PGX) or stored in the database. - Using the Jupyter Notebook Interface
You can use the Jupyter notebook interface to create, load, and query PGQL property graphs through Python. - Additional Client Tools for Querying PGQL Property Graphs
When working with PGQL property graphs in the database, you can use other supported client tools.
Related Topics
Parent topic: PGQL Property Graphs
12.1 Using the Graph Visualization Web Client
You can use the Graph Visualization application to visualize graphs that are either loaded into the graph server (PGX) or stored in the database.
To run the graph visualization application for your installation, see Running the Graph Visualization Web Client.
Related Topics
Parent topic: Getting Started with the Client Tools
12.2 Using the Jupyter Notebook Interface
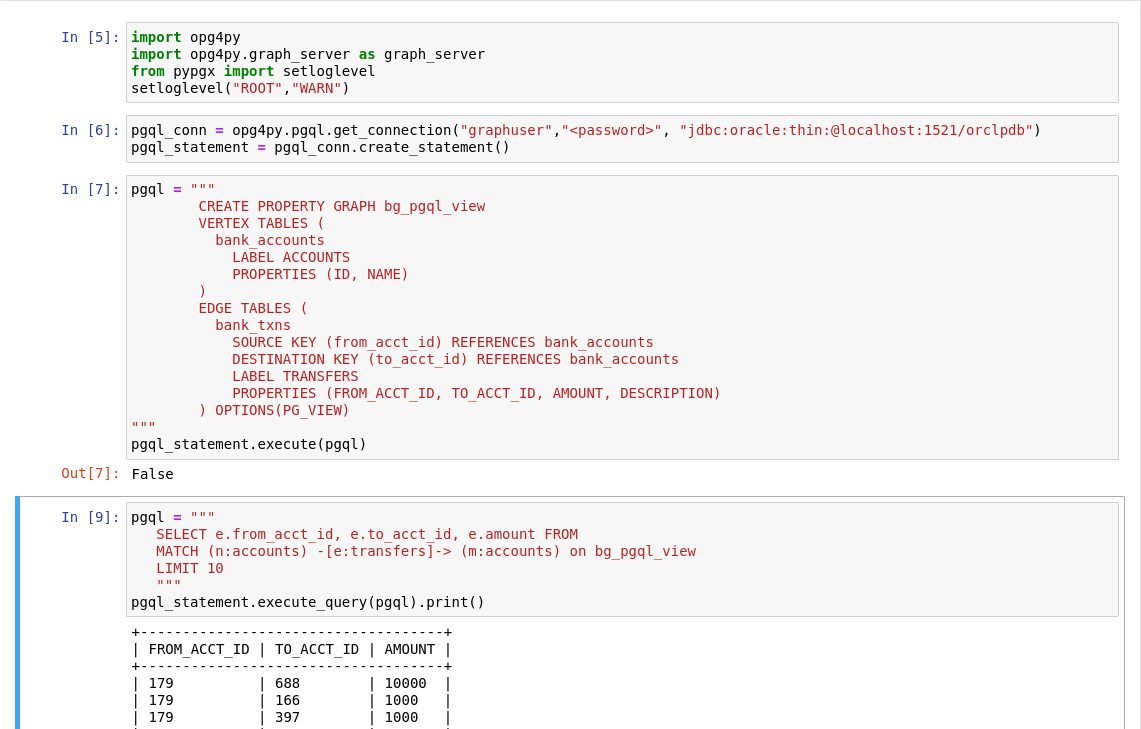
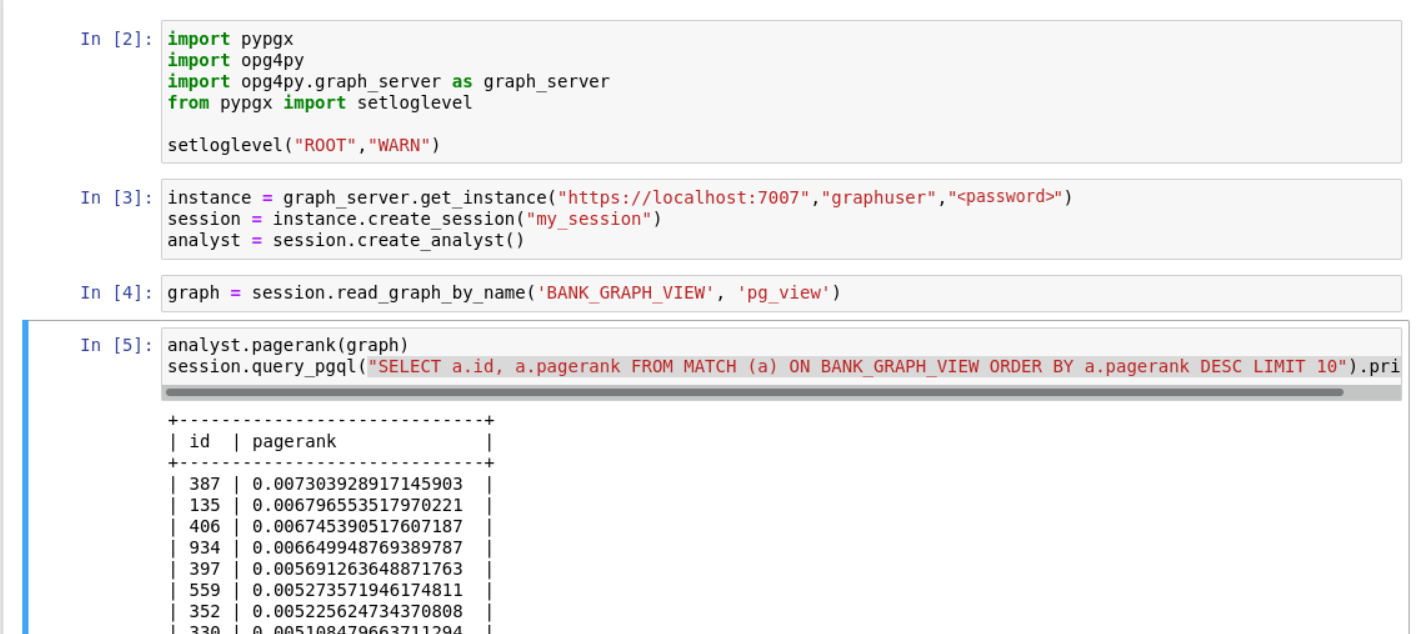
You can use the Jupyter notebook interface to create, load, and query PGQL property graphs through Python.
Perform the following steps to perform graph analysis using Jupyter
Notebook:
Parent topic: Getting Started with the Client Tools

