3.10.4.3 Applying Data-Driven Style to a Map with H3 Aggregations

You can apply different resolutions to your H3 map layer to enhance your visualization.

In case of an H3 aggregation dataset, the hexagonal cells and the distribution of points in these hexagons automatically change at each resolution level, as you zoom in and out of the map. This implies that the color bins for one level might not be the same as for another level.

Spatial Studio provides an option to automatically calculate color bins as you alter your resolutions. You can also turn this option off if you want to test against a set of specific thresholds.

The following steps enable you to apply a data-driven styling option for your H3 map layer.

The instructions assume that you have a H3 map layer displayed on your Active Project page.
  1. Click Menu Icon against the map layer in the Layers tab of the Layers List list.
  2. Select Settings in the context menu.
  3. Configure Style.
  4. Select Based on Data for the Color value under Fill.
    The Style details panel is displayed.
  5. Select the Column to control styling.
  6. Switch on or off the Automatically adjust bin values toggle button.
    • If turned on, the bin values will automatically update as you zoom in or out on the map.
    • If turned off, Create value bins option appears.
  7. Assign colors to the bins based on data values.
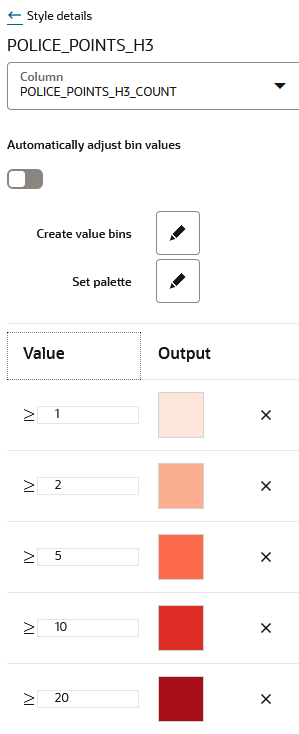
    The following figure shows the Style details panel options:

    Figure 3-63 Applying Data-Driven Color Styling for H3 Map Layer

    Description of Figure 3-63 follows
    Description of "Figure 3-63 Applying Data-Driven Color Styling for H3 Map Layer"
    The color bins on the H3 map layer gets rendered appropriately for different resolutions as shown in the preceding figure.