3.10.2.2.1 Visualizing GeoRaster Data on a Map

You can visualize georaster data on a map using the following steps.
The instructions assume that the GeoRaster dataset is already added to the project in the Active Project page. To create a GeoRaster dataset, see Creating a GeoRaster Dataset for more information.
  1. Click the Visualizations tab on the left pane in the Active Project page.
    This lists the various visualization options.
  2. Click and drag Map from the list to the visualization window on the right to create a map visualization.
    A default base map is displayed with no data visualization layers.
  3. Click the Data tab on the left pane in the Active Project page.
    This lists all the Datasets that are loaded for the project.
  4. Click and drag the desired GeoRaster dataset from the list to the map view on the right.
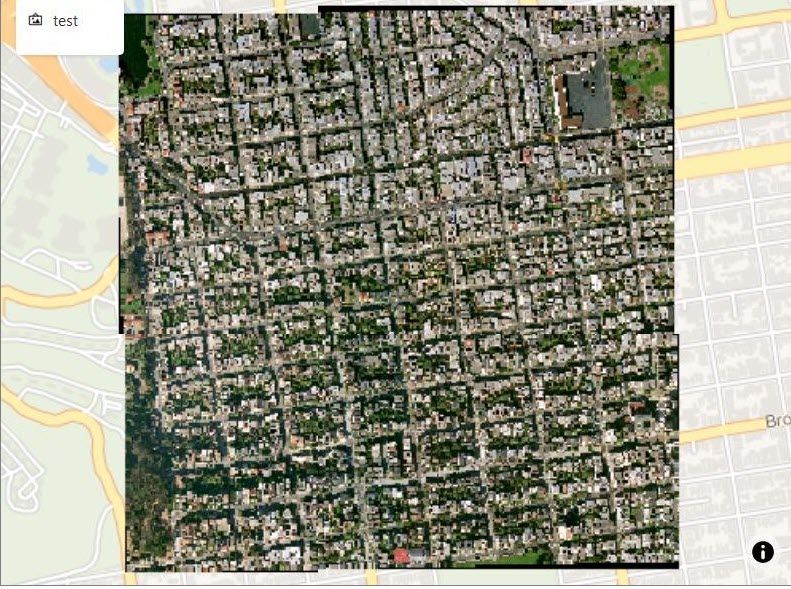
    A GeoRaster layer is created on the map as shown:

    Figure 3-46 GeoRaster Data Visualization

    Description of Figure 3-46 follows
    Description of "Figure 3-46 GeoRaster Data Visualization"

    You can delete the map visualization by clicking the X icon on the top right.

    Tip:

    You can enhance your visual display by modifying your Layer Settings using the Style tab and Raster tab. See Applying Style for a GeoRaster Layer for more information.