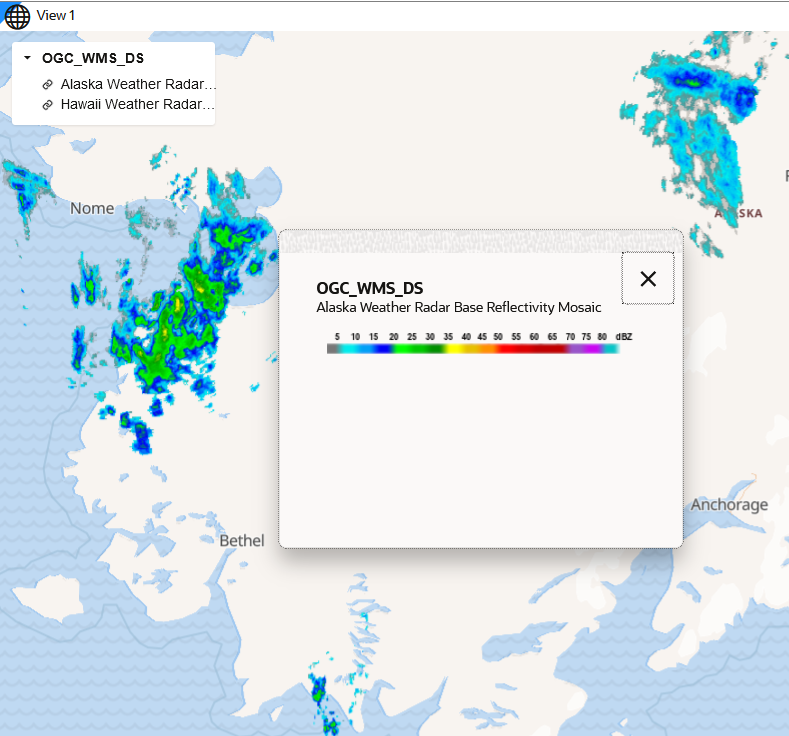
3.10.2.6 Visualizing OGC WMS Maps as a Dataset
You can visualize an OGC (Open Geospatial Consortium) WMS (Web Map Service) dataset on a map.
This is in addition to creating a custom basemap that is based on
external WMS maps, and switching to such a basemap in your map visualization. The main
issue in using basemaps is that a single map visualization can only have one basemap.
For instance, if you are using a basemap based on WMS images, then you can no longer
display other background maps, such as OpenStreetMap. Therefore, the geographic context
is lost as the WMS images typically do not contain detailed administrative boundaries,
or other common features seen on a regular background map.
To overcome this limitation, Spatial Studio allows you to use a regular background map, while adding the WMS map images as a dataset layer on top. As the WMS images are just another dataset, which can be displayed as another layer on the map, you can easily reorder the layers, or toggle the visibility of the WMS images just like with any other map layer.
To visualize an OGC WMS dataset on a map, you must perform the
following steps.
As a prerequisite ensure the following:
- The OGC WMS dataset is created using an OGC WMS connection and exists in Spatial Studio. See Creating an OGC WMS Dataset for more information.
- The required OGC WMS dataset is added to the project in the Active Project page.
Related Topics
Parent topic: Using a Map Visualization
