3.6 Spatial Studio Datasets Page
The Datasets page lets you view and edit existing datasets, and also create new ones.
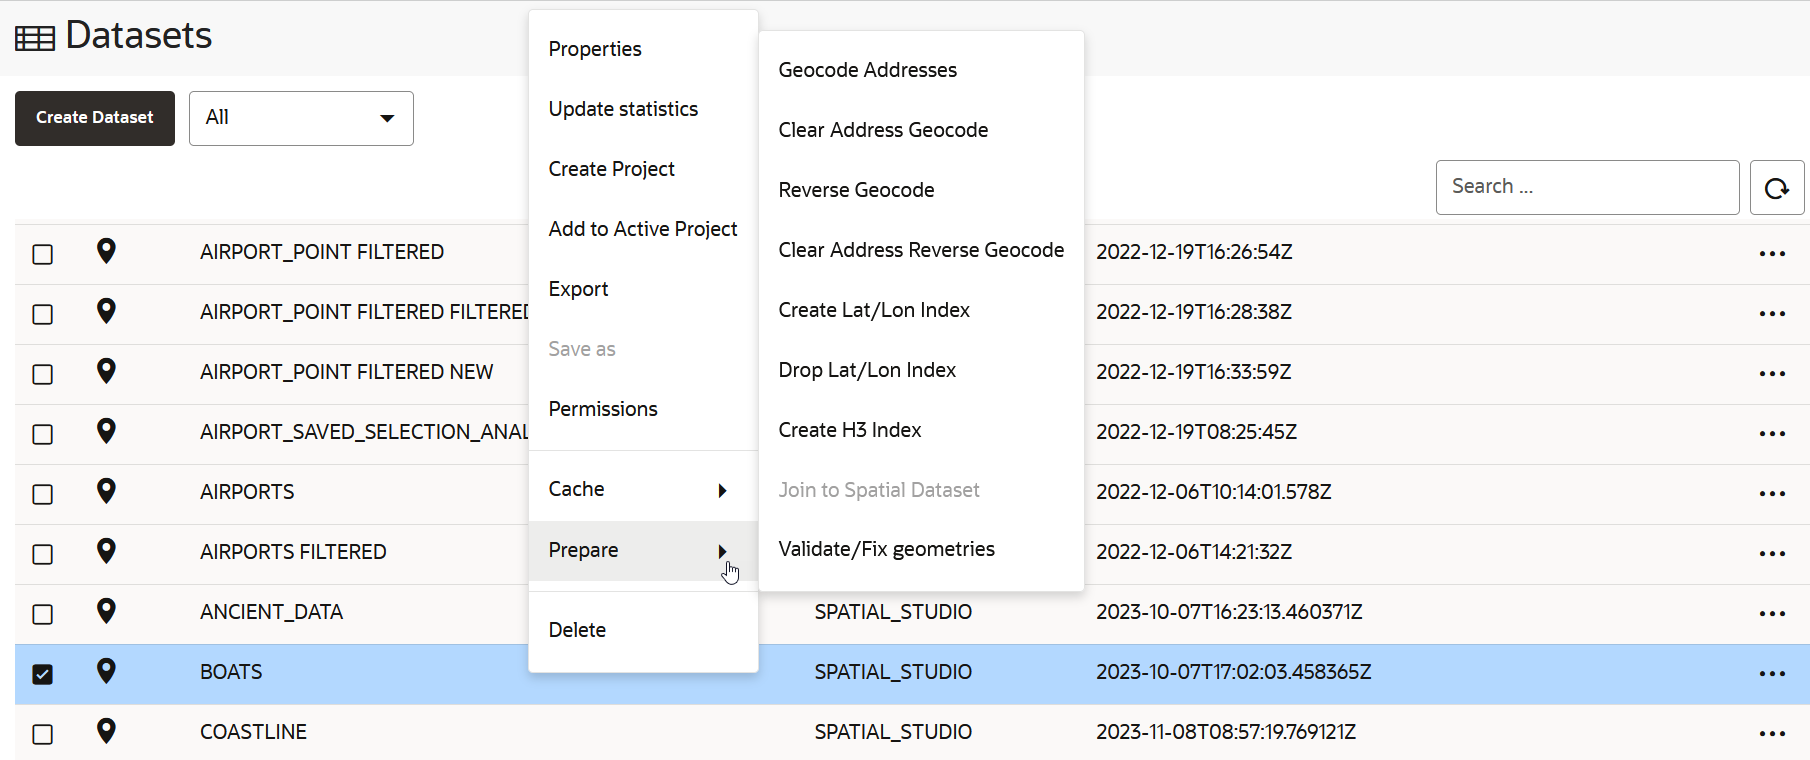
The following figure shows the Datasets page:
Datasets that are displayed on the Datasets page belong to one of the following two categories:
- Manually created by clicking Create Dataset or when you perform a Save as operation with the Create Dataset option enabled. This dataset can then be added to the project for visualization.
- Automatically created when you perform spatial analysis, save selected
features, or store pins as a map layer.
This dataset gets instantly added to the map visualization and also appears listed in the Datasets page. Such a dataset is known as a spatial analysis dataset.
You can perform the following actions on the Datasets page:
- You can manually create a new dataset, by clicking Create Dataset.
- You can filter to view datasets that are either created by you, or shared with you, or both.
- By clicking
 against any displayed dataset or by right-clicking a dataset row, you can
perform the following actions:
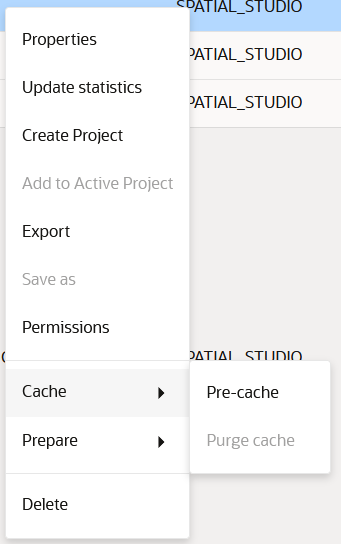
- Properties: View or modify properties of the dataset
- Update Statistics: Update the dataset statistics (refer to Updating Statistics for Datasets)
- Create Project: Create a new project using the dataset
- Add to Active Project: Add the dataset to the project in the Active Project page
- Export: Export the dataset (in GeoJSON or CSV file format)
- Save as: Make a new copy of the dataset
- Permissions: Configure dataset sharing and permissions
- Cache: Control map tiles pre-caching activities (refer to About Cache in Spatial Studio)
- Prepare: Prepare a dataset for any of the following
options:
- Geocode Addresses: Add geocoded information such as geographic coordinates to the dataset
- Clear Address Geocode: Remove geocoded information from the dataset
- Reverse Geocode: Add address information from a set of geographic coordinates to the dataset
- Create Lat/Lon Index: Create latitude/longitude index
- Drop Lat/Lon Index: Remove latitude/longitude index
- Create H3 Index: Prepare an H3 aggregation dataset
- Join to Spatial Dataset: Prepare a non-spatial dataset for map visualization by joining to a spatial dataset
- Validate/Fix geometries: Validate the geometries in the dataset and also fixes the geometries where it is possible for Spatial Studio to do so in an automatic manner.
- Delete: Delete the dataset
- About Creating a Dataset From the Datasets Page
Spatial Studio allows you to create different types of datasets from the Datasets page. - About Spatial Analysis Datasets
Spatial Studio stores the results of a spatial analysis operation in a spatial analysis dataset. Also, storing selected geographic features or pins on a map layer gets saved as a new spatial analysis dataset. - Datasets with Issues
All datasets in Spatial Studio must meet certain data requirements in order to be used for map visualization and analysis. - Geocoding a Dataset
Geocoding is the process of deriving the latitude and longitude coordinates from location details that are geo address types. - Reverse Geocoding a Dataset
Reverse geocoding is the process of deriving the address information from a set of latitude and longitude coordinates. - Enabling Spatiotemporal for a Dataset
In order to visualize and animate spatiotemporal data, you must enable Spatiotemporal for the dataset on the Datasets page. - Preparing a Non-Spatial Dataset for Analysis
Spatial Studio allows you to prepare a non-spatial dataset for mapping and analysis by joining to a spatial dataset. - Exporting a Dataset to GeoJSON
You can export a dataset from Spatial Studio to GeoJSON. - Updating Statistics for Datasets
The Update statistics feature in Spatial Studio gathers statistics of the dataset columns. - About Cache in Spatial Studio
Starting with Spatial Studio release 22.3, all vector tiles generated for all datasets are cached to the file system by default.
Parent topic: Using Oracle Spatial Studio
3.6.1 About Creating a Dataset From the Datasets Page
Spatial Studio allows you to create different types of datasets from the Datasets page.
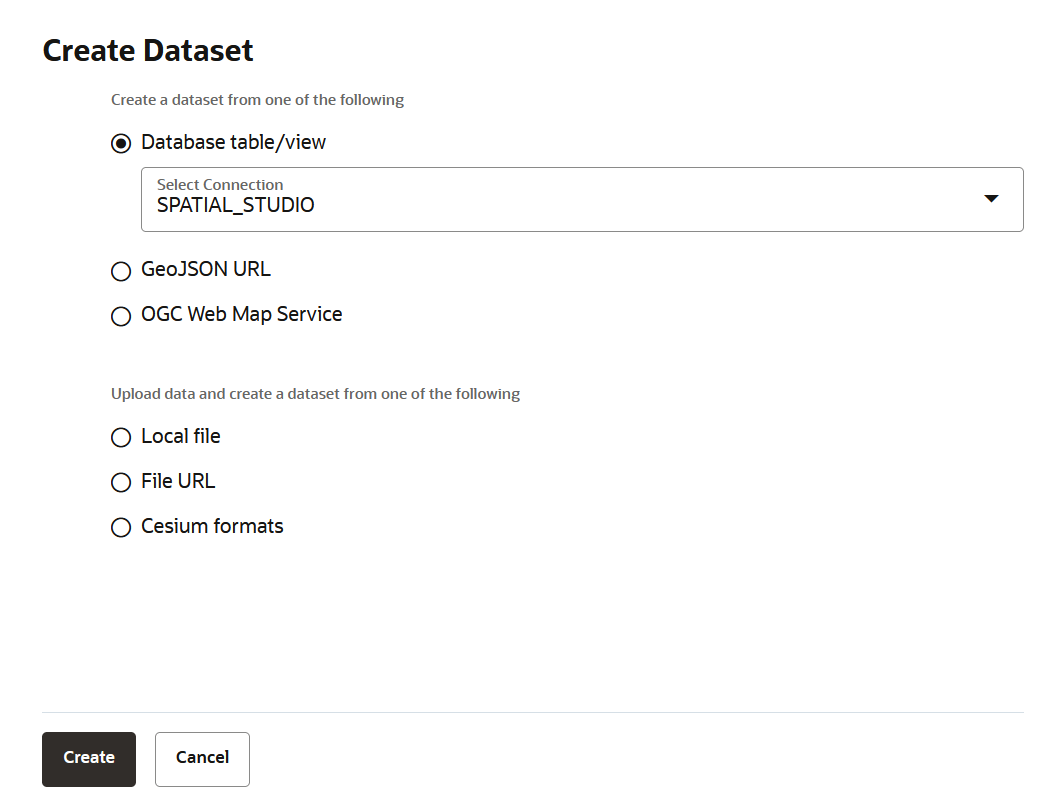
The following figure describes the supported options to create a dataset:
As seen in the preceding figure, you can create a dataset from the following sources:
- Oracle Database table or view using a database connection
- By specifying a GeoJSON URL
- By configuring an OGC Web Map Service
- By uploading dataset files with different formats as supported by Spatial Studio
- By importing geospatial data directly from an external file URL
- By importing 3D Tiles Tileset
The following sections explain in detail the steps to create a dataset using the supported options:
- Creating a Dataset from Database Tables or Views
Using a database connection, you can create a dataset from tables and views in the Oracle Database. - Creating a GeoRaster Dataset
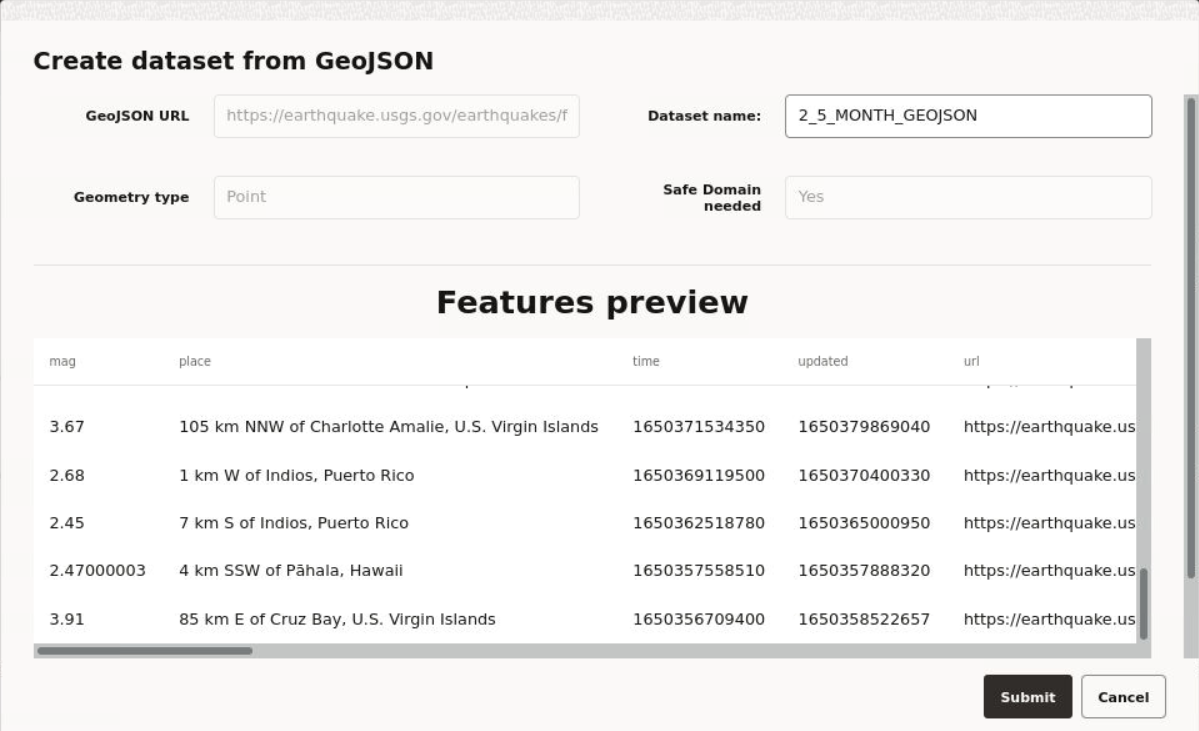
Spatial Studio allows you to create Georaster datasets. - Creating a GeoJSON URL Dataset
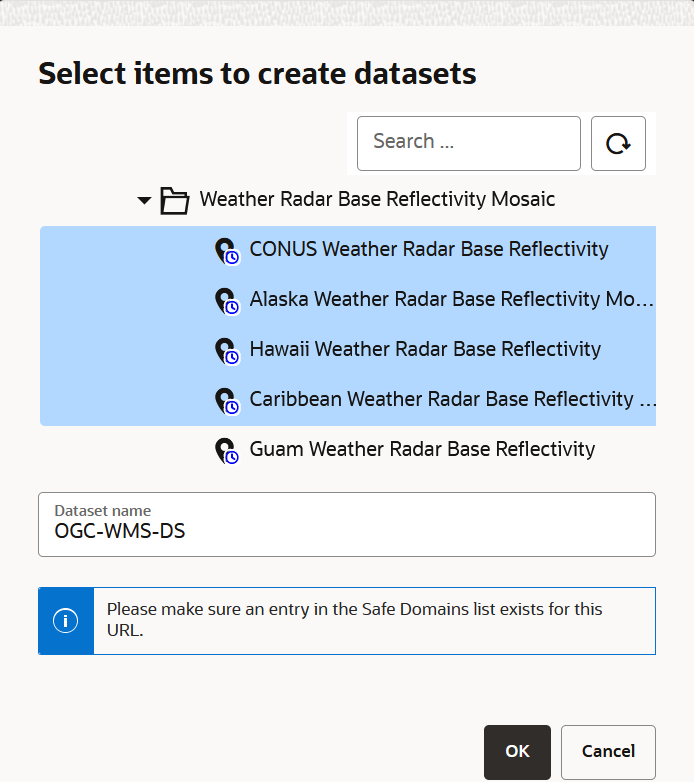
You can create a dataset by specifying a GeoJSON URL. - Creating an OGC WMS Dataset
Starting with Spatial Studio release 22.3, you can define datasets that are based on theGetMapresponses from any external OGC (Open Geospatial Consortium) WMS (Web Map Service) services. - Creating a Dataset by Uploading a File
You can create a dataset by uploading a file in a format supported by Spatial Studio. - Creating a Dataset Using a File URL
You can create a dataset by specifying the URL of an external server which hosts the geospatial file. - Creating a Dataset from Cesium Datasets
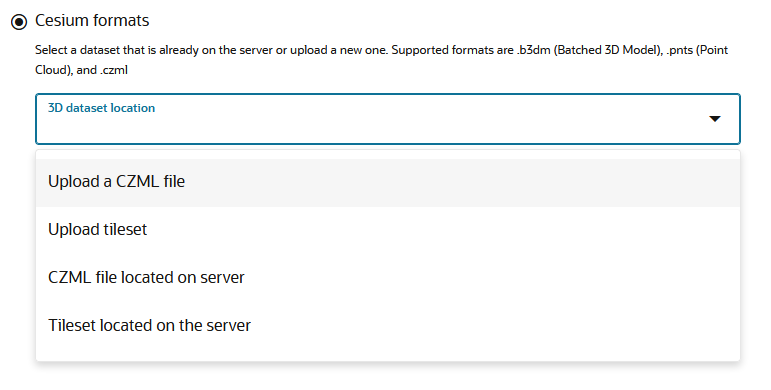
Spatial Studio supports Cesium map visualization by allowing you to create a dataset from a 3D dataset or a CZML file.
Parent topic: Spatial Studio Datasets Page
3.6.1.1 Creating a Dataset from Database Tables or Views
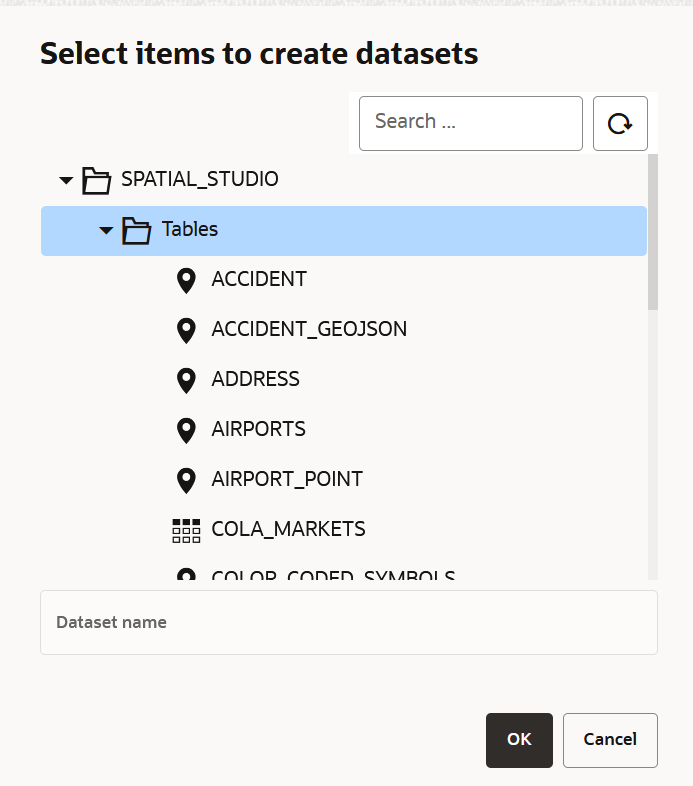
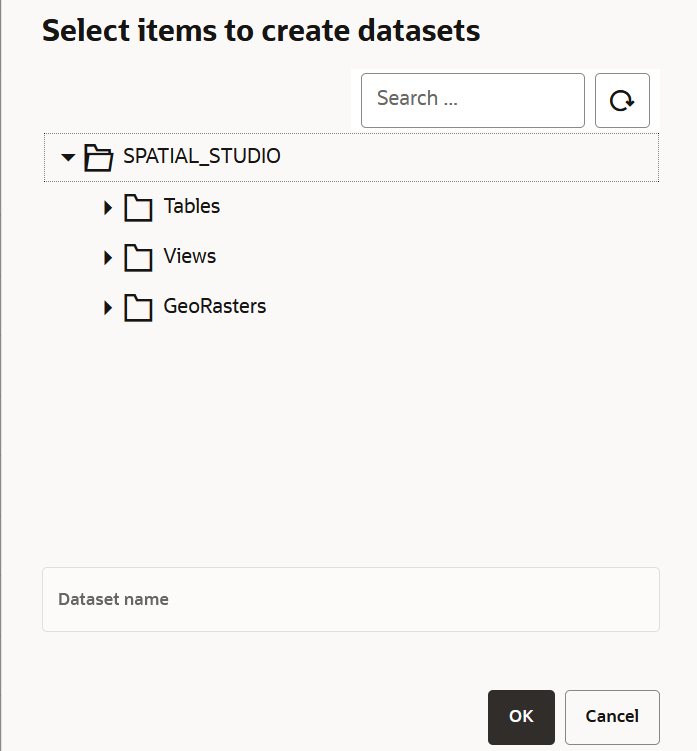
Using a database connection, you can create a dataset from tables and views in the Oracle Database.
Parent topic: About Creating a Dataset From the Datasets Page
3.6.1.2 Creating a GeoRaster Dataset
Spatial Studio allows you to create Georaster datasets.
Parent topic: About Creating a Dataset From the Datasets Page
3.6.1.3 Creating a GeoJSON URL Dataset
You can create a dataset by specifying a GeoJSON URL.
It is important to note the following prior to creating a GeoJSON URL dataset:
- A GeoJSON URL based dataset accesses its data directly from the source URL. There is no database table managed in Spatial Studio for this dataset.
- A GeoJSON URL based dataset does not support Spatial Analysis.
- A GeoJSON URL based dataset is subject to the same upload size limit, or 100MB, whichever is smaller.
- If a GeoJSON URL does not support CORS (Cross-Origin Resource Sharing), then Spatial Studio will act as a proxy to the browser requesting the GeoJSON URL data.
Parent topic: About Creating a Dataset From the Datasets Page
3.6.1.4 Creating an OGC WMS Dataset
Starting with Spatial Studio release
22.3, you can define datasets that are based on the GetMap responses from
any external OGC (Open Geospatial Consortium) WMS (Web Map Service) services.
Parent topic: About Creating a Dataset From the Datasets Page
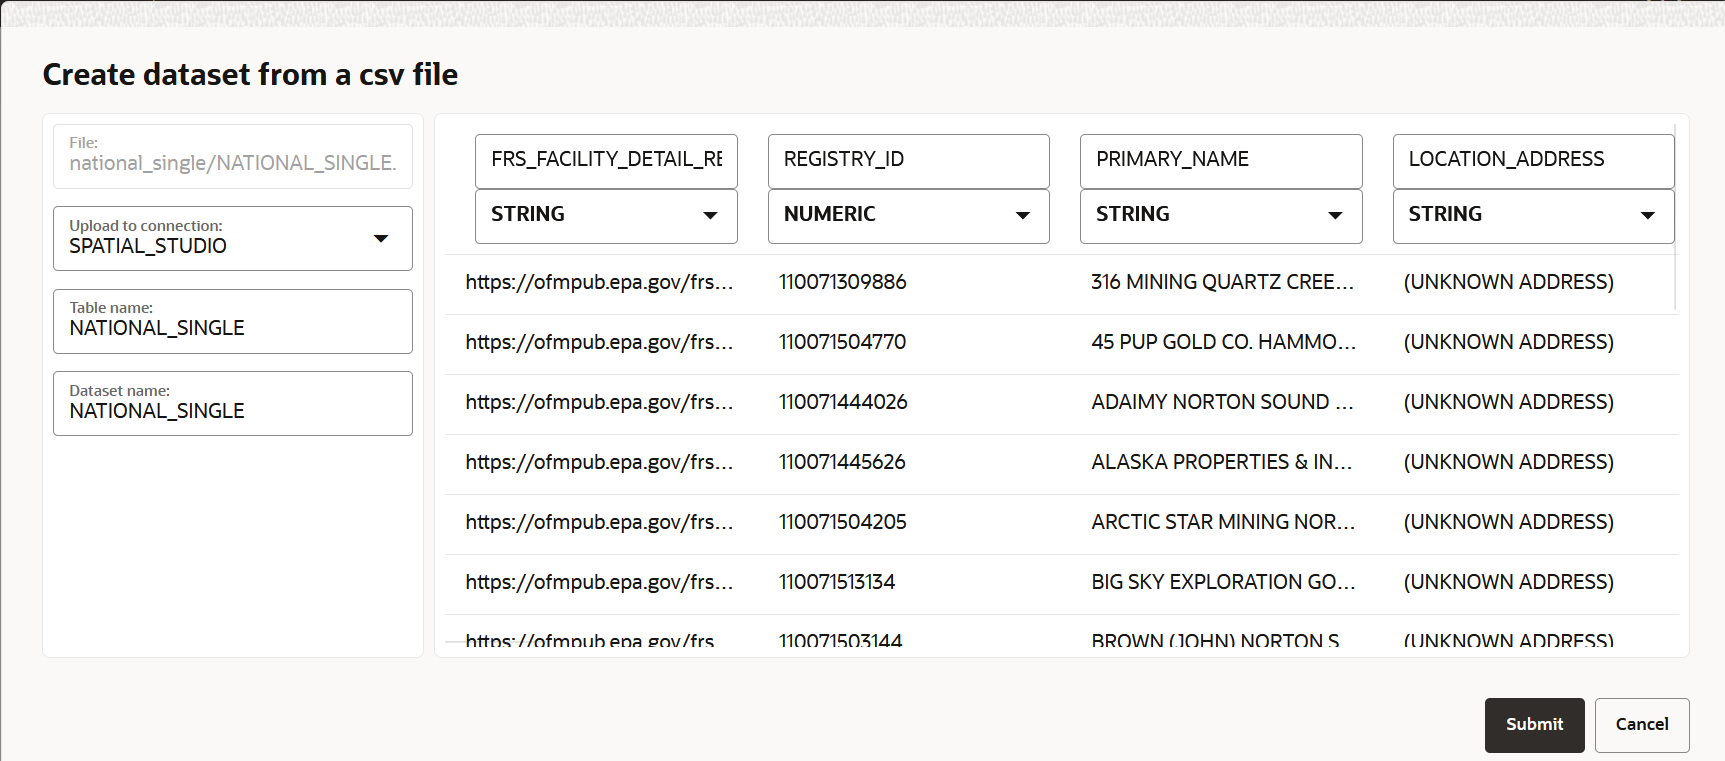
3.6.1.5 Creating a Dataset by Uploading a File
You can create a dataset by uploading a file in a format supported by Spatial Studio.
- Excel file
- Shapefile
- GeoJSON file
- CSV file
- KML file
Also, note the following:
- WKT or GeoJSON geometry text values in Excel or CSV files are
supported.
If you are uploading a file with WKT text values, then only WKT strings representing geodetic coordinates (longitude and latitude) are supported.
- Three dimensional coordinates are supported in GeoJSON files.
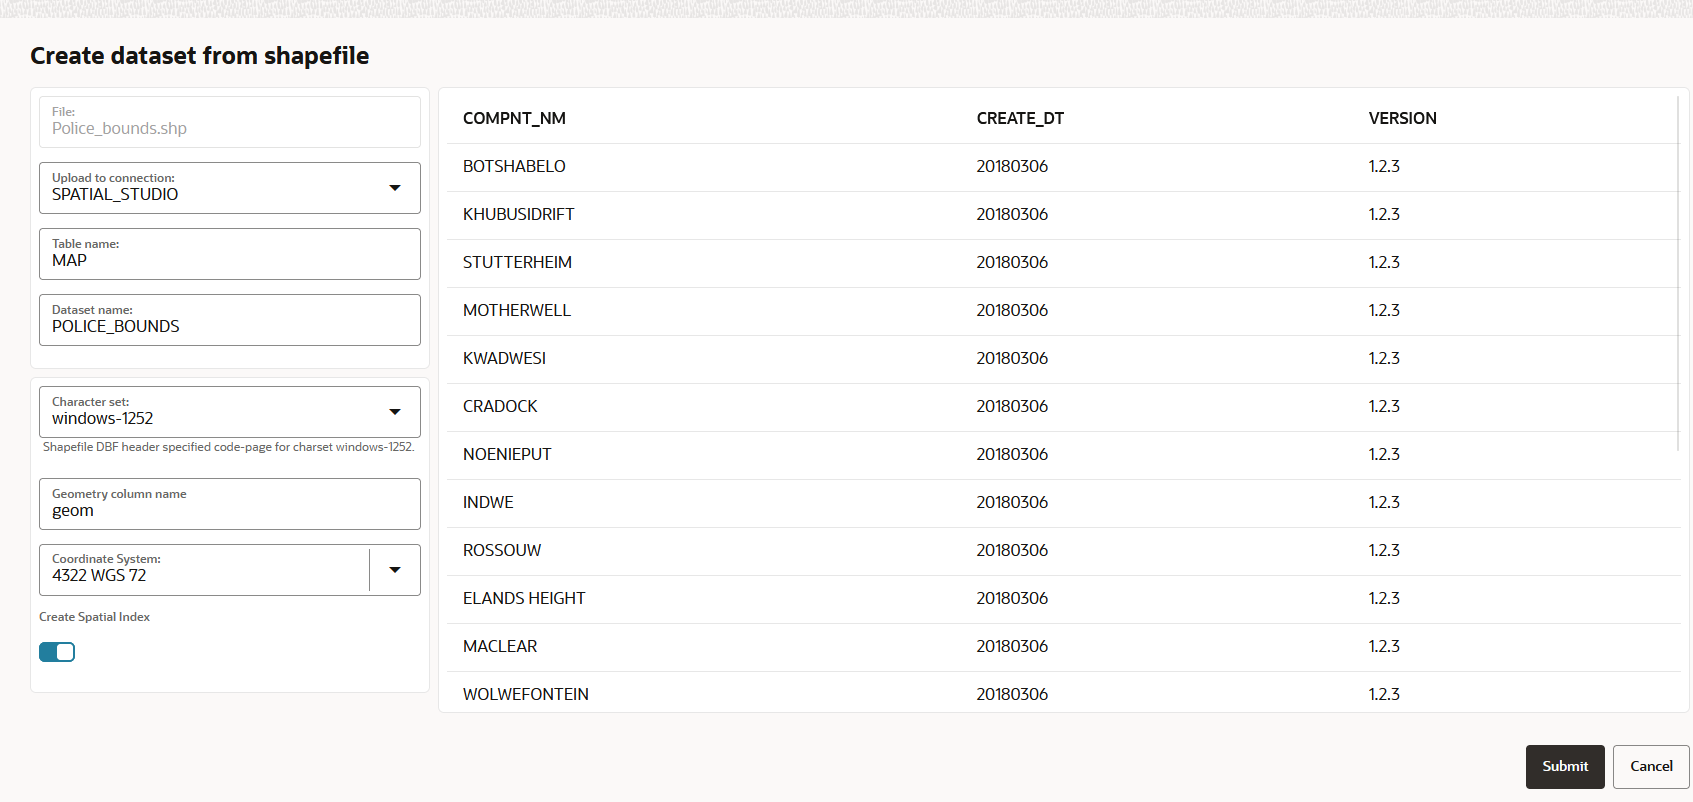
- Uploading a Shapefile
You can create a dataset by uploading a shapefile.
Parent topic: About Creating a Dataset From the Datasets Page
3.6.1.5.1 Uploading a Shapefile
You can create a dataset by uploading a shapefile.
.shp- Stores the geometry data.shx- Stores the index of the geometry.dbf- Stores the attribute information of geometry features.prj- Stores the coordinate system information.cpg- Specifies the character set to be used
Parent topic: Creating a Dataset by Uploading a File
3.6.1.6 Creating a Dataset Using a File URL
You can create a dataset by specifying the URL of an external server which hosts the geospatial file.
Parent topic: About Creating a Dataset From the Datasets Page
3.6.1.7 Creating a Dataset from Cesium Datasets
Spatial Studio supports Cesium map visualization by allowing you to create a dataset from a 3D dataset or a CZML file.
Parent topic: About Creating a Dataset From the Datasets Page
3.6.2 About Spatial Analysis Datasets
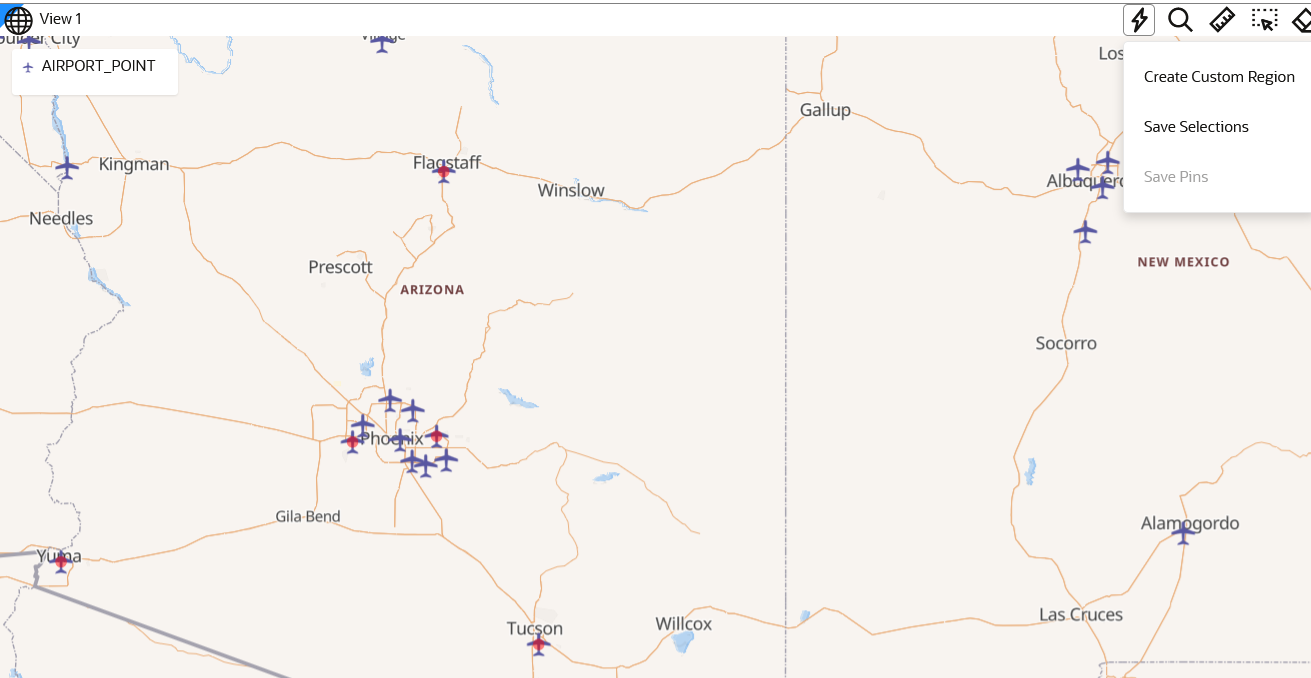
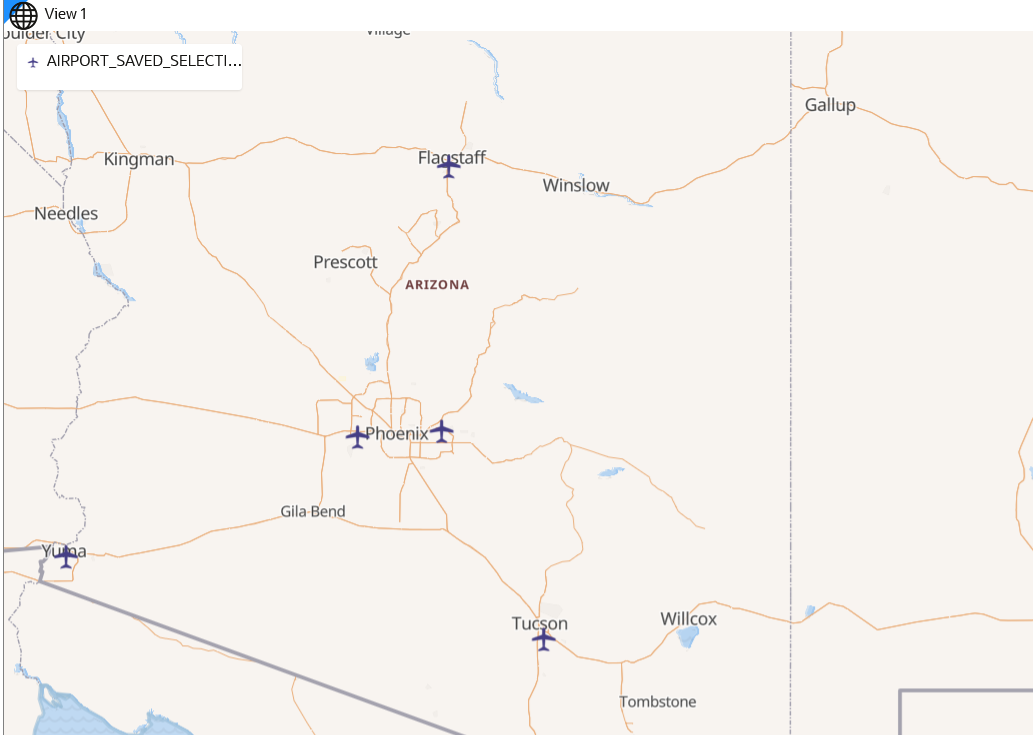
Spatial Studio stores the results of a spatial analysis operation in a spatial analysis dataset. Also, storing selected geographic features or pins on a map layer gets saved as a new spatial analysis dataset.
When you perform any new spatial analysis operation (such as filtering, combining, transforming existing datasets, and so on) against a data source in map visualization, the results of the analysis are generated into a spatial analysis dataset. Similarly, when you store selected geographic locations or pins on a map layer, the spatial data gets stored as spatial analysis datasets. These datasets get instantly added to the map visualization project and appear under Analysis in the Active Project page. You can also view these datasets on the Datasets page.
- Saving Selected Features on a Map Into a Dataset
You can save selected features on a map layer into a new spatial analysis dataset. - Saving Pins on a Map Into a Dataset
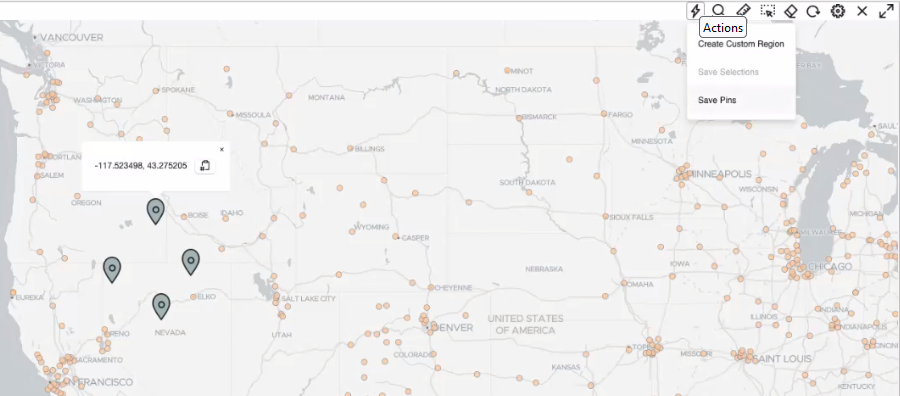
You can save all the pins that you dropped on a map layer into a spatial analysis dataset.
Related Topics
Parent topic: Spatial Studio Datasets Page
3.6.2.1 Saving Selected Features on a Map Into a Dataset
You can save selected features on a map layer into a new spatial analysis dataset.
The following steps enable you to save selected features on a map layer into a dataset.
Parent topic: About Spatial Analysis Datasets
3.6.2.2 Saving Pins on a Map Into a Dataset
You can save all the pins that you dropped on a map layer into a spatial analysis dataset.
This dataset containing the stored pins can later be used in various spatial analyses.
The following steps enable you to save multiple pins on a map layer into a dataset.
Related Topics
Parent topic: About Spatial Analysis Datasets
3.6.3 Datasets with Issues
All datasets in Spatial Studio must meet certain data requirements in order to be used for map visualization and analysis.
Otherwise, Spatial Studio highlights these datasets with a warning on the Datasets page.
Table 3-2 Selected List of Dataset Issues
| Issue | Cause | Spatial Studio Resolution |
|---|---|---|
| No key column was found | Primary key is missing on the dataset. |
|
| This dataset needs spatial metadata and index | The geometry column in the dataset does not have the spatial metadata or a spatial index or both. | Click Create Spatial Metadata and Index to create the spatial metadata and index for the geometry column. |
| Preparation Required for mapping and spatial analysis | It can be due to one of the following reasons:
|
Depending on the cause, you may need to perform one of the
following:
|
Parent topic: Spatial Studio Datasets Page
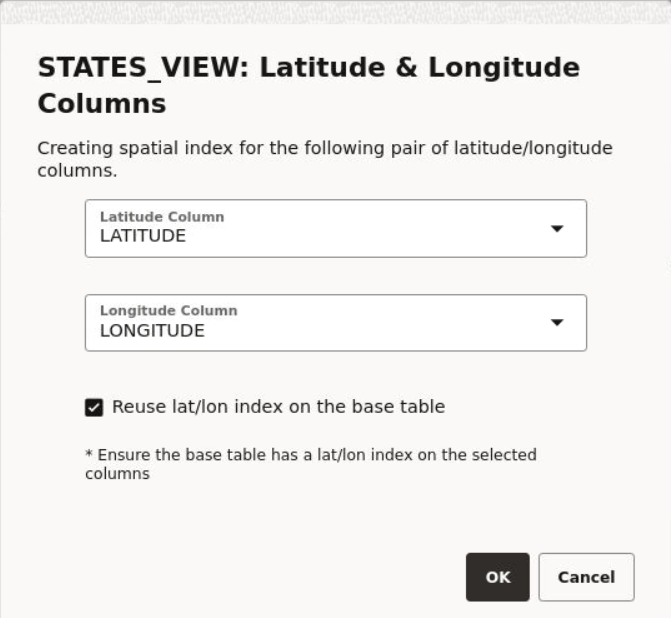
3.6.3.1 Enabling Spatial on a View-Based Dataset with Latitude and Longitude Columns
The instructions assume:
- You have created a dataset from a view having latitude and
longitude columns.
See Creating a Dataset from Database Tables or Views for more information on creating a dataset from a view.
- This view-based dataset is listed on the Datasets page with a warning icon since the dataset is not spatially enabled for visualization.
Parent topic: Datasets with Issues
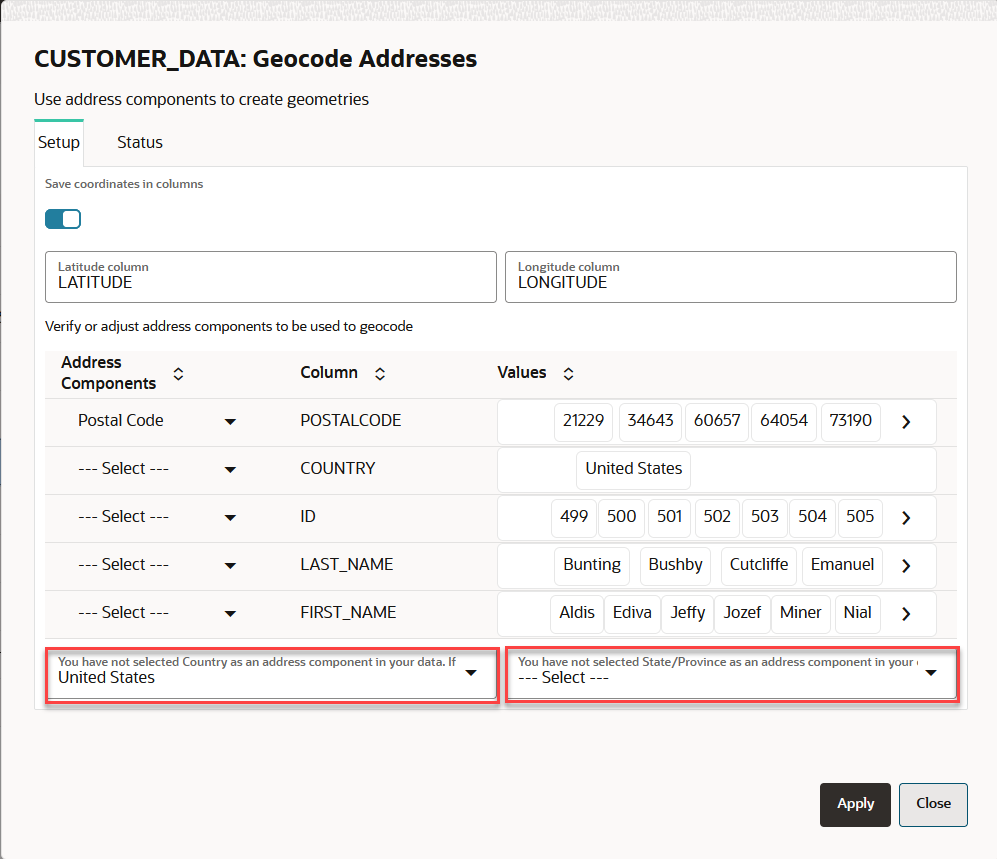
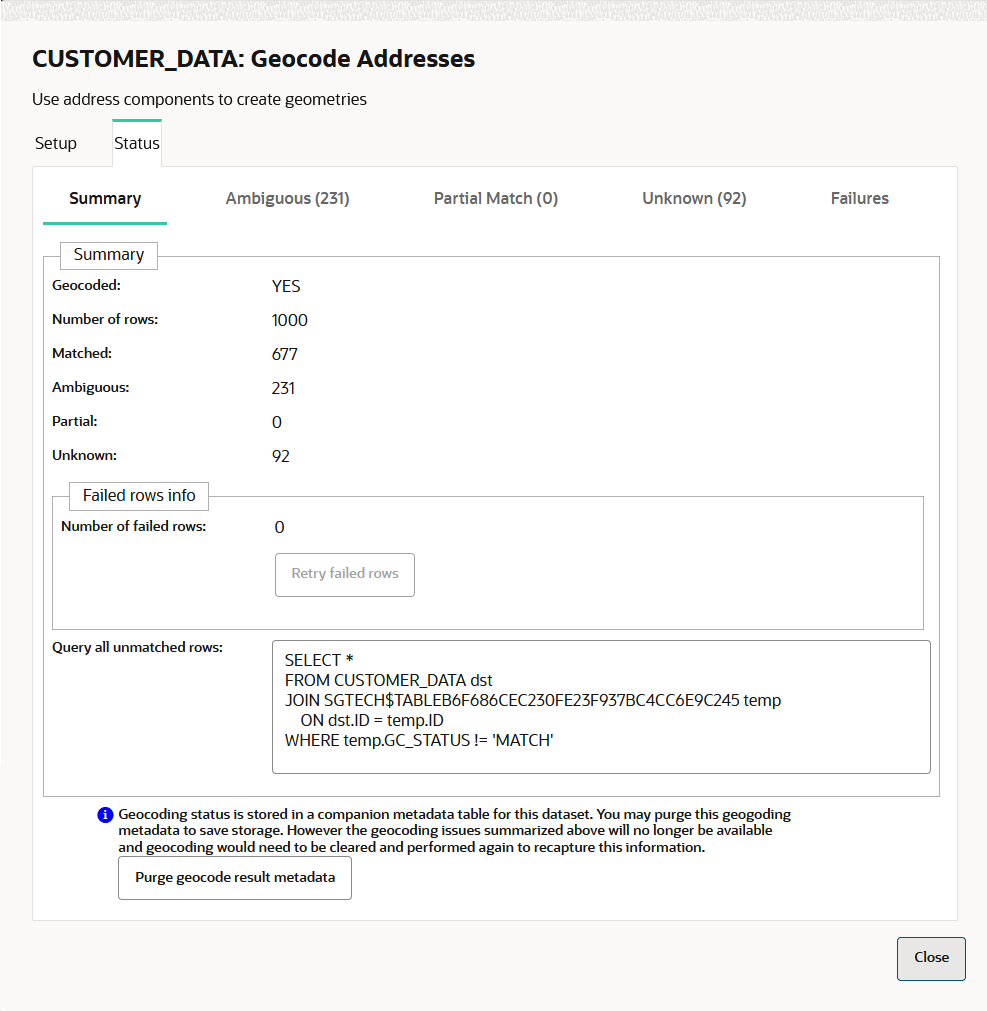
3.6.4 Geocoding a Dataset
Geocoding is the process of deriving the latitude and longitude coordinates from location details that are geo address types.
You can geocode a dataset in Spatial Studio to store the resulting latitude and longitude information as a
SDO_GEOMETRY column. Optionally, you can also store them in
latitude and longitude numeric columns in the underlying database table referenced
by the dataset.
Prior to geocoding a dataset, if the Spatial Studio server is running behind a firewall, then ensure you have the correct Web Proxy information configured in the Administration page. This is because the Spatial Studio application uses an external Oracle hosted geocoding service which is on the public internet.
You can perform the following steps to geocode a dataset.
Parent topic: Spatial Studio Datasets Page
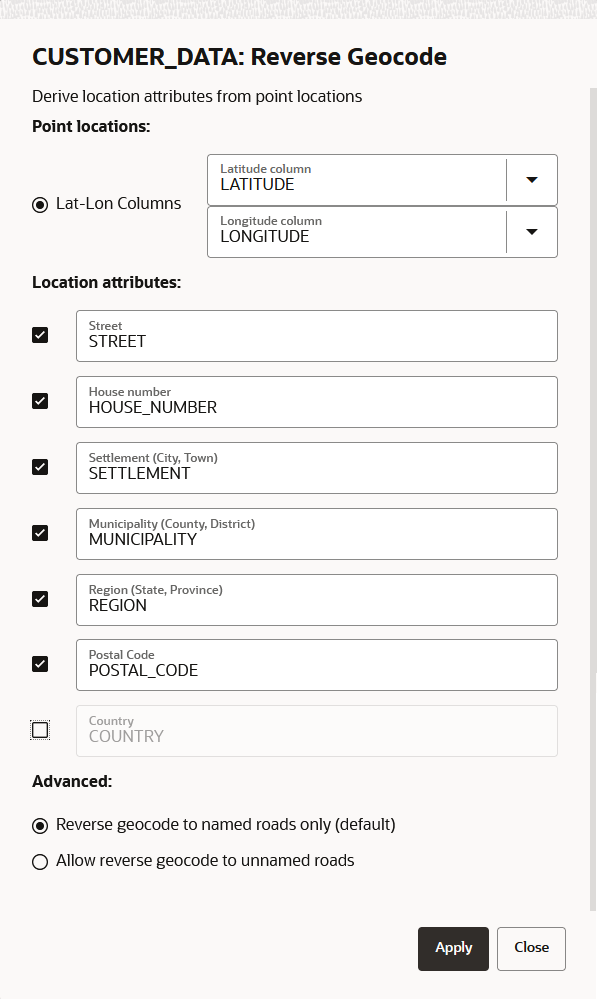
3.6.5 Reverse Geocoding a Dataset
Reverse geocoding is the process of deriving the address information from a set of latitude and longitude coordinates.
You can reverse geocode a dataset in Spatial Studio to add address information to the dataset's table using the following steps.
Note:
Reverse Geocoding is supported only in point or latitude and longitude datasets.Parent topic: Spatial Studio Datasets Page
3.6.6 Enabling Spatiotemporal for a Dataset
In order to visualize and animate spatiotemporal data, you must enable Spatiotemporal for the dataset on the Datasets page.
Spatial Studio supports visualization and animation of spatiotemporal map layers using a Cesium Timeline widget (see Overview of the Cesium Timeline Widget). These map layers can listen to the timeline only if you enable Spatiotemporal on the underlying datasets.
Characteristics of a Spatiotemporal Dataset
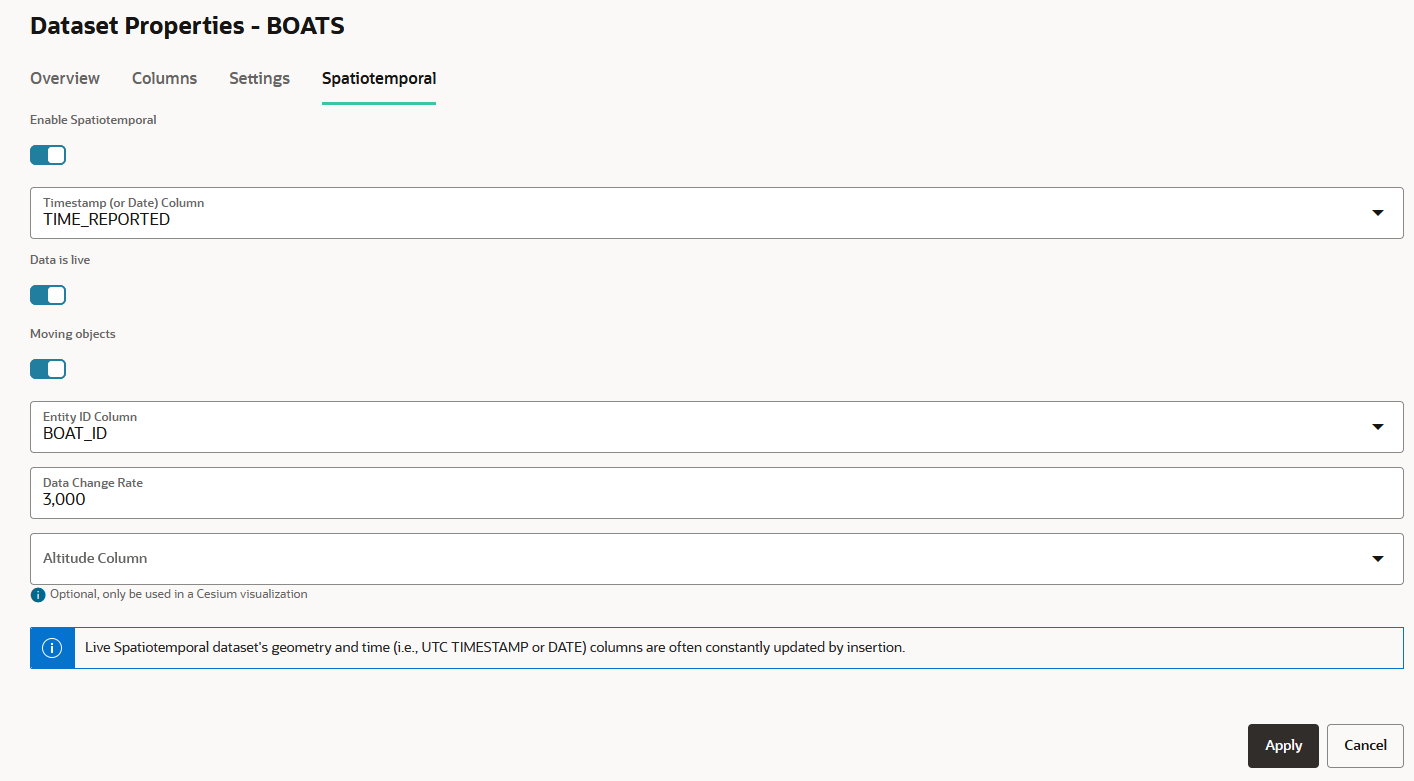
Spatial Studio considers a dataset to contain spatiotemporal data if it belongs to any one of the following types.- Live Spatiotemporal Dataset: A dataset which meets the
following characteristics is known as a Live dataset:
- The dataset is based on a geometry table or view with a geometry column or pair of latitude/longitude columns.
- The dataset has one or more entities (that represent an object in the dataset) which are uniquely identified by one of the columns.
- The dataset's underlying table or view contains a column of
the type
TIMESTAMPorDATE(or a qualifying field in the GeoJSON response), that stores the UTC datetime of the entities as they are being observed and recorded. - The dataset's underlying table or view must have ongoing inserts with recently obtained location data of entities being observed or monitored.
Spatial Studio considers all the different dataset rows of the same entity id as entries representing the entity with different
TIMESTAMPvalues. However, they may or may not have varying location coordinates or geometries. Hence, these live spatiotemporal datasets can again be classified as shown:- Moving Objects: For each entity, if the location or
geometry change with changing
TIMESTAMPvalues, then these datasets are called moving objects datasets. In this case, a trail layer (if it is a qualifying geometry) gets added, which shows the trajectory of the moving object as a line string by fetching data for lastNseconds (or higher time unit). - Non-Moving Objects: For each entity, if only certain
properties change (and not the location or geometry) with changing
TIMESTAMP, then these are called non-moving objects datasets. In this case, no trail layer gets added as only the properties change with time.
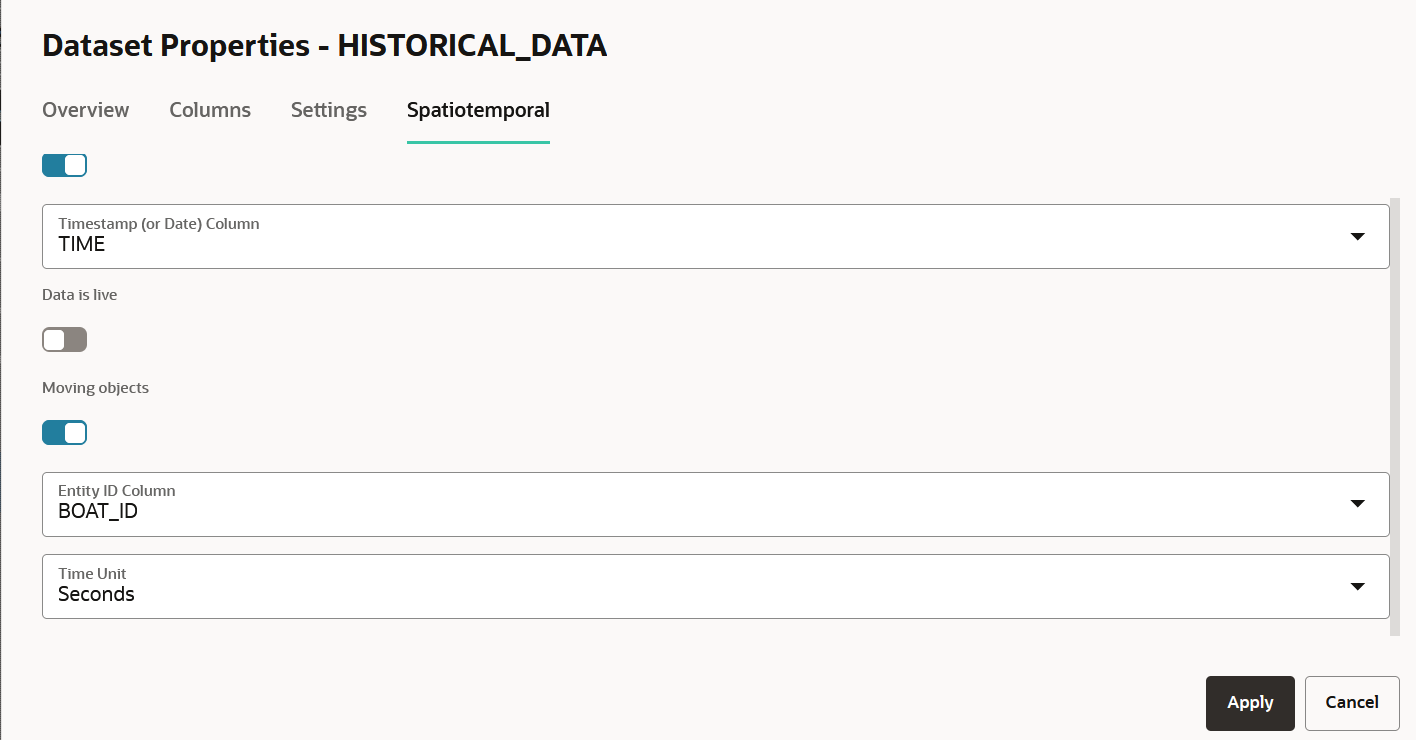
- Non-Live Spatiotemporal Dataset: A dataset with the
following characteristics is known as a Non-Live dataset:
- The dataset is based on a geometry table or view with a geometry column or pair of latitude/longitude columns.
- The dataset's underlying table or view contains a
TIMESTAMPorDATEtype column that contains historic time values.
- Moving Objects: Similar to a Live dataset, if
this dataset contains entities (that uniquely represent an object in the
dataset) with varying
TIMESTAMPvalues, then a trail layer gets added. The trail layer shows the trajectory of the moving object as a line string by fetching data for lastNseconds (or higher time unit). - Non-Moving Objects: In this configuration, the
dataset is just treated to have various rows with different
TIMESTAMPvalues (not grouped by any entity id).
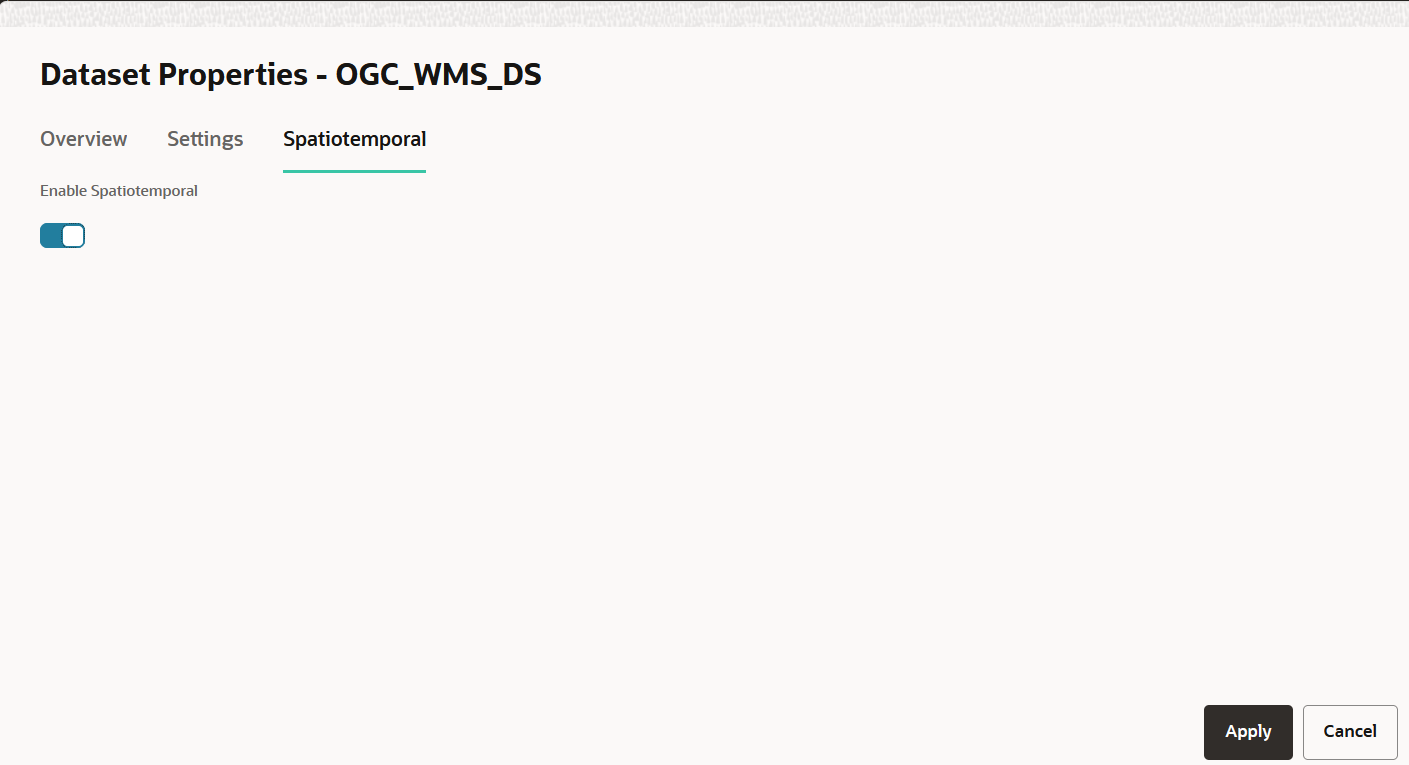
- Time-enabled WMS Dataset: If a WMS Service offers a time dimension for an image layer selected in a WMS dataset, then that WMS Dataset can be configured as spatiotemporal.
- GeoJSON URL (external) Dataset: These types of datasets can be configured to refresh periodically based on an interval value.
- Configuring Spatiotemporal for Live Moving Objects Dataset
- Configuring Spatiotemporal for Live and Non-Moving Objects Dataset
- Configuring Spatiotemporal for Non-Live Moving Objects Dataset
- Configuring Spatiotemporal for Non-Live and Non-Moving Objects Dataset
- Configuring Spatiotemporal for OGC WMS Datasets
- Configuring Spatiotemporal for GeoJSON URL Datasets
Parent topic: Spatial Studio Datasets Page
3.6.6.1 Configuring Spatiotemporal for Live Moving Objects Dataset
Related Topics
Parent topic: Enabling Spatiotemporal for a Dataset
3.6.6.2 Configuring Spatiotemporal for Live and Non-Moving Objects Dataset
Related Topics
Parent topic: Enabling Spatiotemporal for a Dataset
3.6.6.3 Configuring Spatiotemporal for Non-Live Moving Objects Dataset
Related Topics
Parent topic: Enabling Spatiotemporal for a Dataset
3.6.6.4 Configuring Spatiotemporal for Non-Live and Non-Moving Objects Dataset
Related Topics
Parent topic: Enabling Spatiotemporal for a Dataset
3.6.6.5 Configuring Spatiotemporal for OGC WMS Datasets
Related Topics
Parent topic: Enabling Spatiotemporal for a Dataset
3.6.6.6 Configuring Spatiotemporal for GeoJSON URL Datasets
Related Topics
Parent topic: Enabling Spatiotemporal for a Dataset
3.6.7 Preparing a Non-Spatial Dataset for Analysis
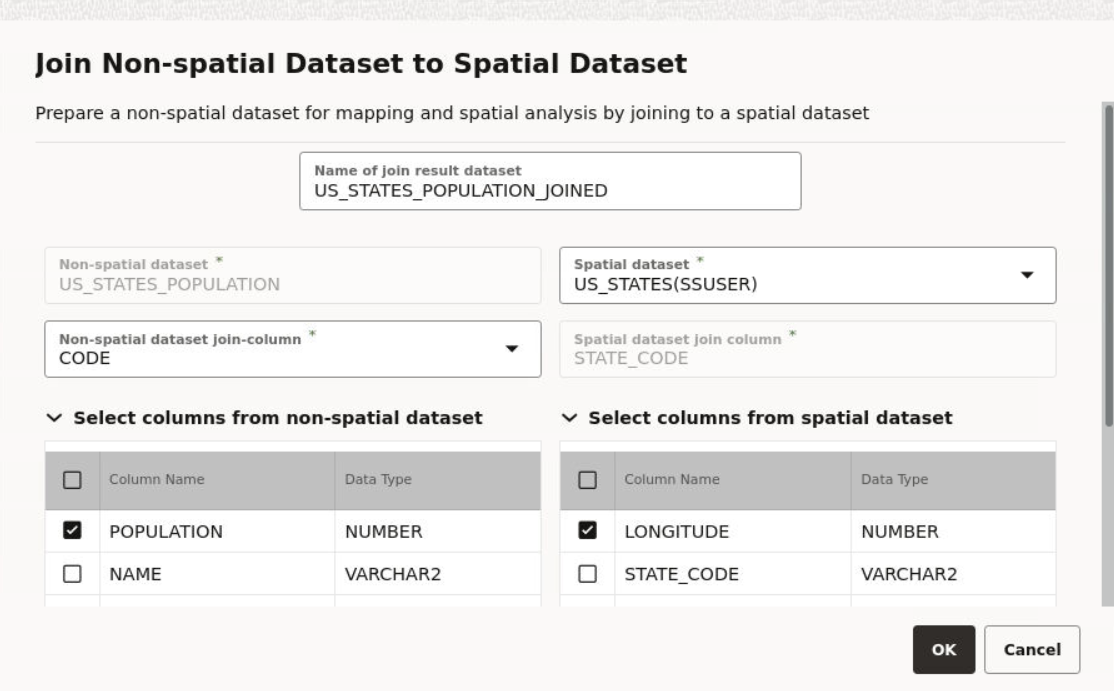
Spatial Studio allows you to prepare a non-spatial dataset for mapping and analysis by joining to a spatial dataset.
Note the following highlights about joining two datasets:
- You can only join a non-spatial dataset to a spatial dataset and not conversely.
- It is essential that the non-spatial data in one dataset is linked to the spatial data in the other dataset through a common primary key column.
- You can choose the columns for the newly created joined dataset from the attributes of the datasets associated in the join operation.
Parent topic: Spatial Studio Datasets Page
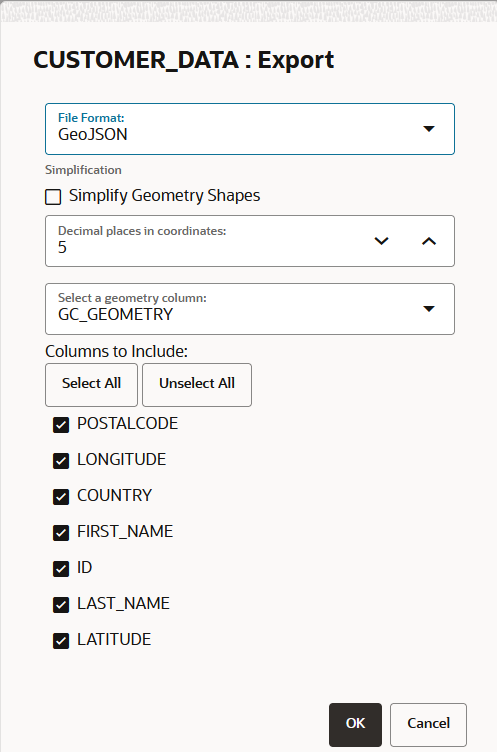
3.6.8 Exporting a Dataset to GeoJSON
You can export a dataset from Spatial Studio to GeoJSON.
Parent topic: Spatial Studio Datasets Page
3.6.9 Updating Statistics for Datasets
The Update statistics feature in Spatial Studio gathers statistics of the dataset columns.
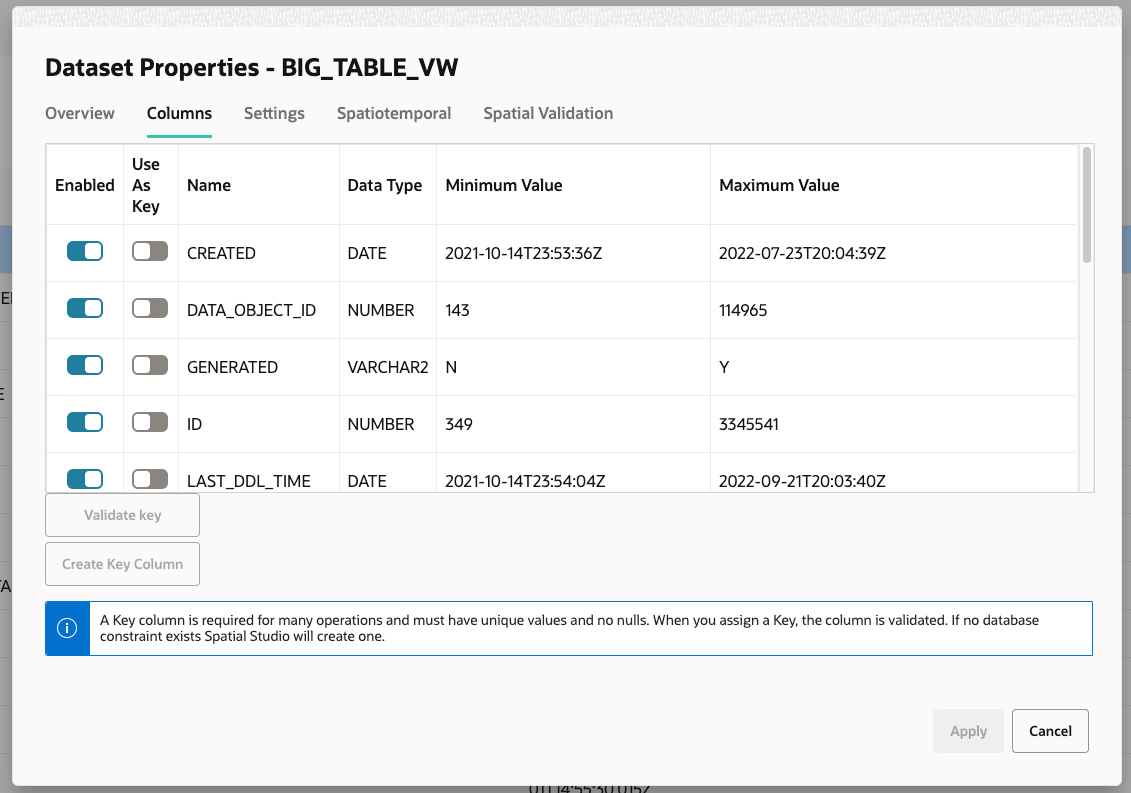
To gather the dataset statistics, right-click on the dataset and select Update statistics. For all datasets (except view-based and spatial analysis datasets), this action triggers a single background job which collects the relevant statistical data. Once the job completes successfully on the Jobs page, you can verify the updated statistical data by viewing the Dataset Properties.
- Gather dataset statistics [basic]: This job collects the basic statistics such as Name and DataType of columns in a dataset. When this job completes successfully, the job in step-2 is triggered.
- Gather dataset statistics [full]: This job
collects more detailed statistics such as Minimum Value,
Maximum Value, Bounding Box,
and unique column values. As long as this job is in the
Processingstatus, the view-based dataset may show incomplete information for the Minimum Value and Maximum Value columns in the Dataset Properties dialog:Figure 3-31 Gathering Statistics In Progress
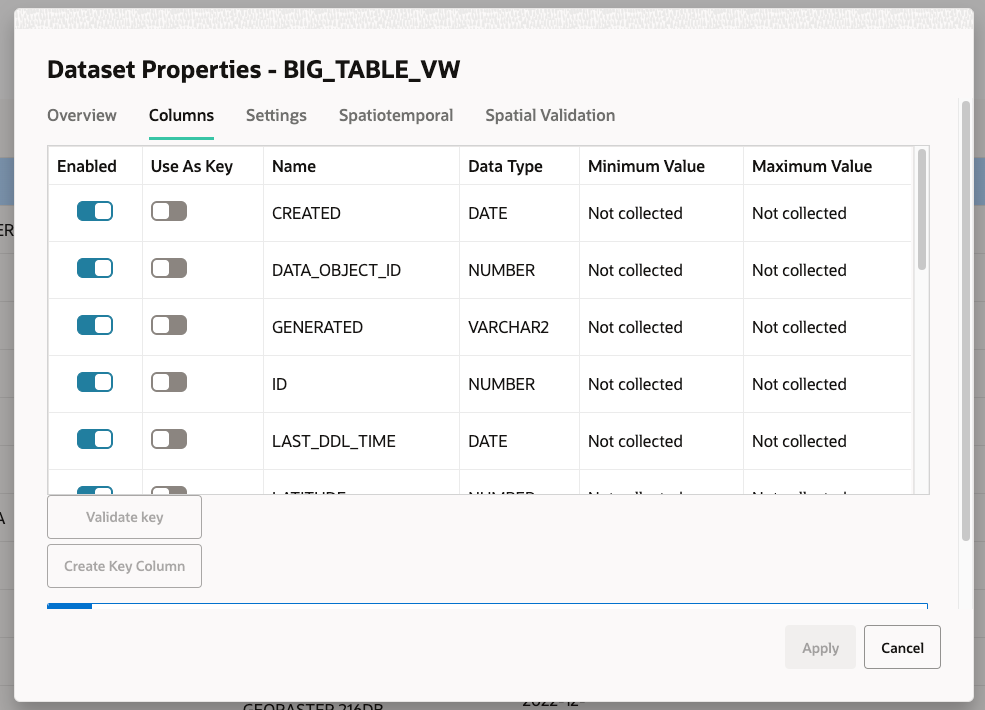
Description of "Figure 3-31 Gathering Statistics In Progress"Once the job status is
Done, the Dataset Properties reflects the gathered statistics.Figure 3-32 Displaying Gathered Statistics
Description of "Figure 3-32 Displaying Gathered Statistics"
Note that for any type of dataset, you must always ensure that this background job completes successfully before performing advanced styling or visualization of a dataset.
Parent topic: Spatial Studio Datasets Page
3.6.10 About Cache in Spatial Studio
Starting with Spatial Studio release 22.3, all vector tiles generated for all datasets are cached to the file system by default.
This cache process automatically begins when the you first load a dataset for map visualization and start panning the map or zoom in and out on the map. Therefore, the next time the same dataset is visualized, all the corresponding map layers load faster as the relevant tiles have been already generated and are ready to be loaded. All these generated vector tiles will be saved under:
<user_home_folder>/.sgtech/cache/CACHE_<cache_id>
The <cache_id> which is part of the folder name is an
integer value, calculated based on the dataset id and the
geometry column being encoded in the vector tiles. A metadata file will be
saved inside each cache folder to provide human-readable
information about where the tiles belong to in a tiles.json
file. A sample structure of the metadata file is as shown:
{
  "DatasetName" : "DATASET NAME",
  "DatasetId" : "8da55629d3ca71aa37d859422a847257",
  "GeometryColumn" : "GEOM_COL_NAME"
}
Each vector tile will be encoded and saved to a file that follows a name pattern as shown:
<zoom_level>_<x_axis>_<y_axis>.dat
All the variables in the preceding name pattern are replaced by an integer and denote the world position where the tile needs to be loaded when looking at a certain viewport of the world map.
The cache options (Pre-cache and Purge cache) for a dataset can be accessed from the Datasets page as shown:
- Pre-Cache
You can trigger a pre-caching task to start generating vector tiles even before a map is loaded with the dataset for visualization. - Purge Cache
You can wipe the cached tiles by calling the Purge cache option.
Parent topic: Spatial Studio Datasets Page
3.6.10.1 Pre-Cache
You can trigger a pre-caching task to start generating vector tiles even before a map is loaded with the dataset for visualization.
See Figure 3-33 to access the Pre-cache option.
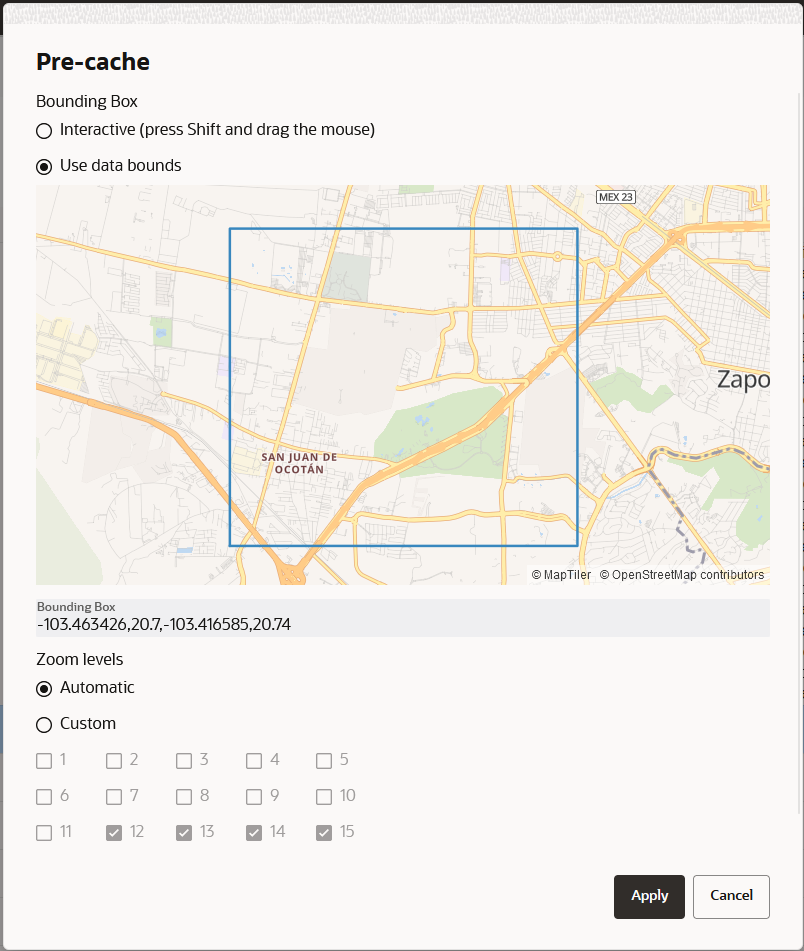
Pre-caching can infer where the data is located and suggest the data bounds for caching. In case if the information is not available, then you can interactively select the part of the world that needs to be included in the pre-caching task. Spatial Studio also suggests the zoom levels that are best suited for the data. However, you can always override this and configure your own choice for the Zoom levels.
Figure 3-34 Configuring Zoom Levels for Pre-Caching Task
Description of "Figure 3-34 Configuring Zoom Levels for Pre-Caching Task"
Note:
Based on the complexity of the data and the number of zoom levels to pre-cache, this task could take from a couple of minutes to several hours. Therefore, be cautious on what you opt to include in this process as the database connections and CPU usage could heavily be impacted by this task.The pre-cached tiles are saved in the file system, following the name pattern
discussed in the earlier section. Extra information about the bounding
rectangle and zoom levels that were pre-cached are included in the
tiles.json file as shown:
{
  "DatasetName" : "DATASET NAME",
  "DatasetId" : "8da55629d3ca71aa37d859422a847257",
  "GeometryColumn" : "GEOM_COL_NAME",
  "ZoomLevels" : [ 13, 14, 15 ],
  "BoundingBox" : [ -103.455841, 20.708551, -103.421479, 20.73044 ]
}
Parent topic: About Cache in Spatial Studio
3.6.10.2 Purge Cache
You can wipe the cached tiles by calling the Purge cache option.
See Figure 3-33 to access the Purge cache option.
This option is helpful whenever the database data changes causing the already generated vector tiles to become stale.
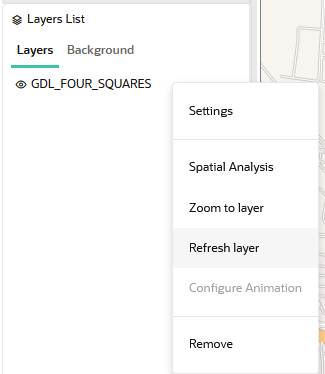
Alternatively, you can also select the Refresh layer option for each dataset layer that is added to the map visualization in the Active Project page as shown:
This indirectly triggers a Purge cache operation, before generating the vector tiles again.
You must perform a cache purge or layer refresh whenever you apply any of the following changes to a dataset:
- Change the key column of a dataset
- Enable or disable columns of a dataset
- Change the contents of your dataset's source table
Otherwise, you will be viewing stale data on the map and interacting with this data may also result in errors.
Parent topic: About Cache in Spatial Studio
