4.3 Using a Cesium Map Visualization
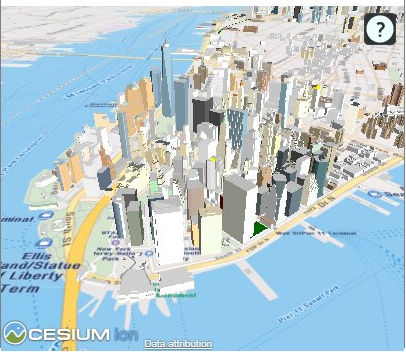
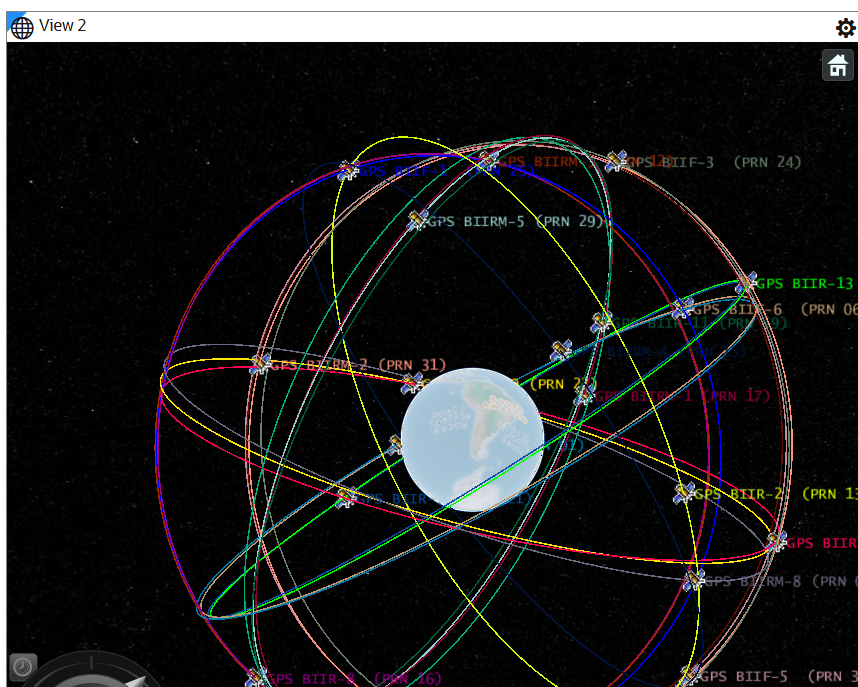
Spatial Studio uses a CesiumJS plugin that allows you to view 3D visualizations using 3D Tiles or CZML data on a Cesium map.
Cesium map allows you to display your real-world geospatial 3D data in a 3D environment. In order to build interactive 3D visualizations using Cesium maps, you can upload one of the following files to Spatial Studio:
- 3D Tileset: Supports formats are:
- Point Cloud (
.pnts) - Batched 3D Model
(
.b3dm)
- Point Cloud (
- CZML file: CZML formatted data in
.czmlfiles
It is important to note the following when using a Cesium map visualization:
- Generating 3D Tiles or CZML formatted data file for your geospatial 3D data must be carried out using any third party software outside of Oracle Spatial Studio.
- 3D Tiles and CZML files are stored in the file system on Spatial Studio's server, not in Oracle Database.
- Currently this feature supports only displaying 3D Tiles and CZML data on maps. It does not support 3D analysis.
Parent topic: Visualization in Oracle Spatial Studio
4.3.1 Visualizing a 3D Tileset Using a Cesium Map
You can visualize your dataset with 3D Tiles on a Cesium map using the
following steps.
The instructions assume that the 3D Tiles are uploaded and the dataset
is already added to the project in the Active Project page. To create a dataset with 3D
Tiles, see Creating a Dataset from Cesium Datasets for more information.
Parent topic: Using a Cesium Map Visualization
4.3.2 Visualizing CZML Data Using a Cesium Map
You can visualize your CZML dataset on a Cesium map using the
following steps.
The instructions assume that the CZML formatted data is uploaded and
the CZML dataset is already added to the project in the Active Project page. To create a
dataset using
.czml file, see Creating a Dataset from Cesium Datasets for more information.
Parent topic: Using a Cesium Map Visualization


