Using a 3D Scene Visualization
Spatial Studio uses a CesiumJS plugin that allows you to view 3D scene visualizations on a map using 3D Tiles, CZML data, or any regular geometry-based datasets.
A 3D Scene allows you to display your real-world geospatial 3D data in a 3D environment. In order to build interactive 3D scene visualizations, you can create a dataset using one of the following file formats:
- 3D Tileset: Supported formats are:
- Point Cloud (
.pnts) - Batched 3D Model
(
.b3dm)
- Point Cloud (
- CZML file: CZML formatted data in
.czmlfiles - Other file formats:
.csv,.xls,.geojson, and.shpfiles.
See Creating a Dataset from 3D Scene Formats for more information.
It is important to note the following:
- Generating 3D Tiles or CZML formatted data file for your geospatial 3D data must be carried out using any third party software outside of Oracle Spatial Studio.
- 3D Tiles and CZML files are stored in the file system on Spatial Studio's server or referenced using a URL. They are not stored in Oracle Database.
- When using a URL, ensure that the URL is added to the safe domains list on the Console page by the Spatial Studio administrator.
- Currently, this feature supports only displaying 3D data on maps. It does not support 3D analysis.
Visualizing a 3D Tileset Using a 3D Scene
- Click and drag the desired 3D Tiles dataset from the list to the map
view on the right.A 3D layer is created on the map as shown:To interact with the map, click the ? icon and use either of the following options shown:
Figure 4-24 3D Scene Visualization Using Tileset
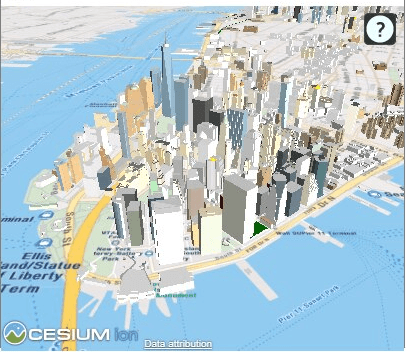
Description of "Figure 4-24 3D Scene Visualization Using Tileset"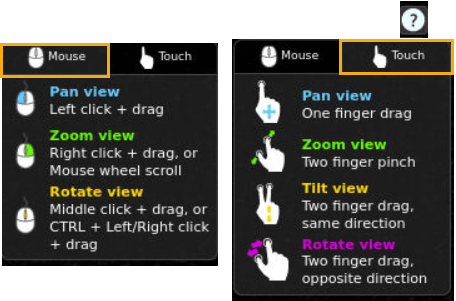
Description of the illustration pointer_options.png
Visualizing CZML Data Using a 3D Scene
.czml file, see Creating a Dataset from 3D Scene Formats for more information.
- Click and drag the desired CZML dataset from the list to the map view on
the right.A 3D layer is created on the map as shown:
Figure 4-25 3D Scene Visualization Using a CZML Dataset
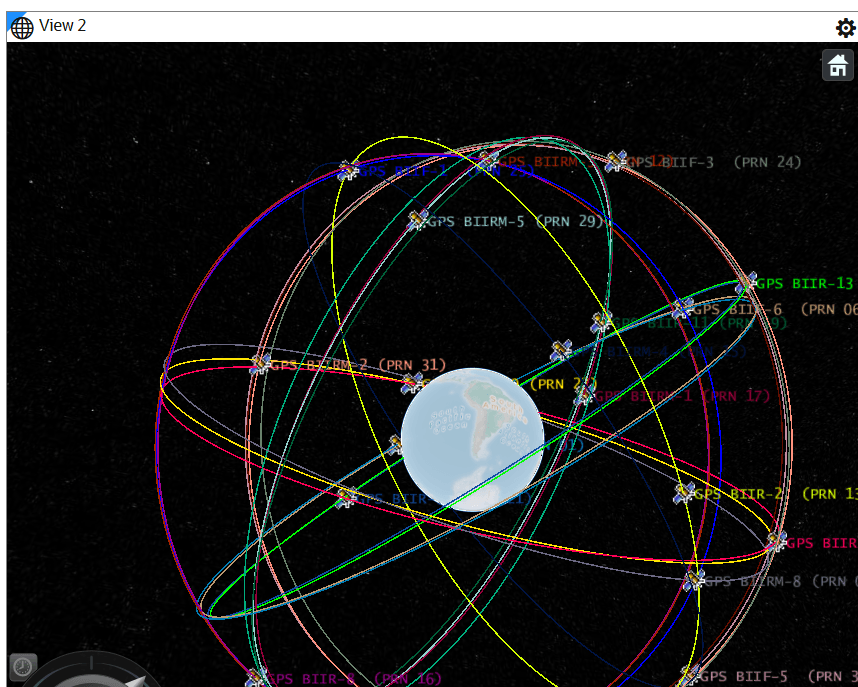
Description of "Figure 4-25 3D Scene Visualization Using a CZML Dataset"