Metrics Dashboard Features
Here are the important features available in the Metrics Dashboard.
Metrics Explorer
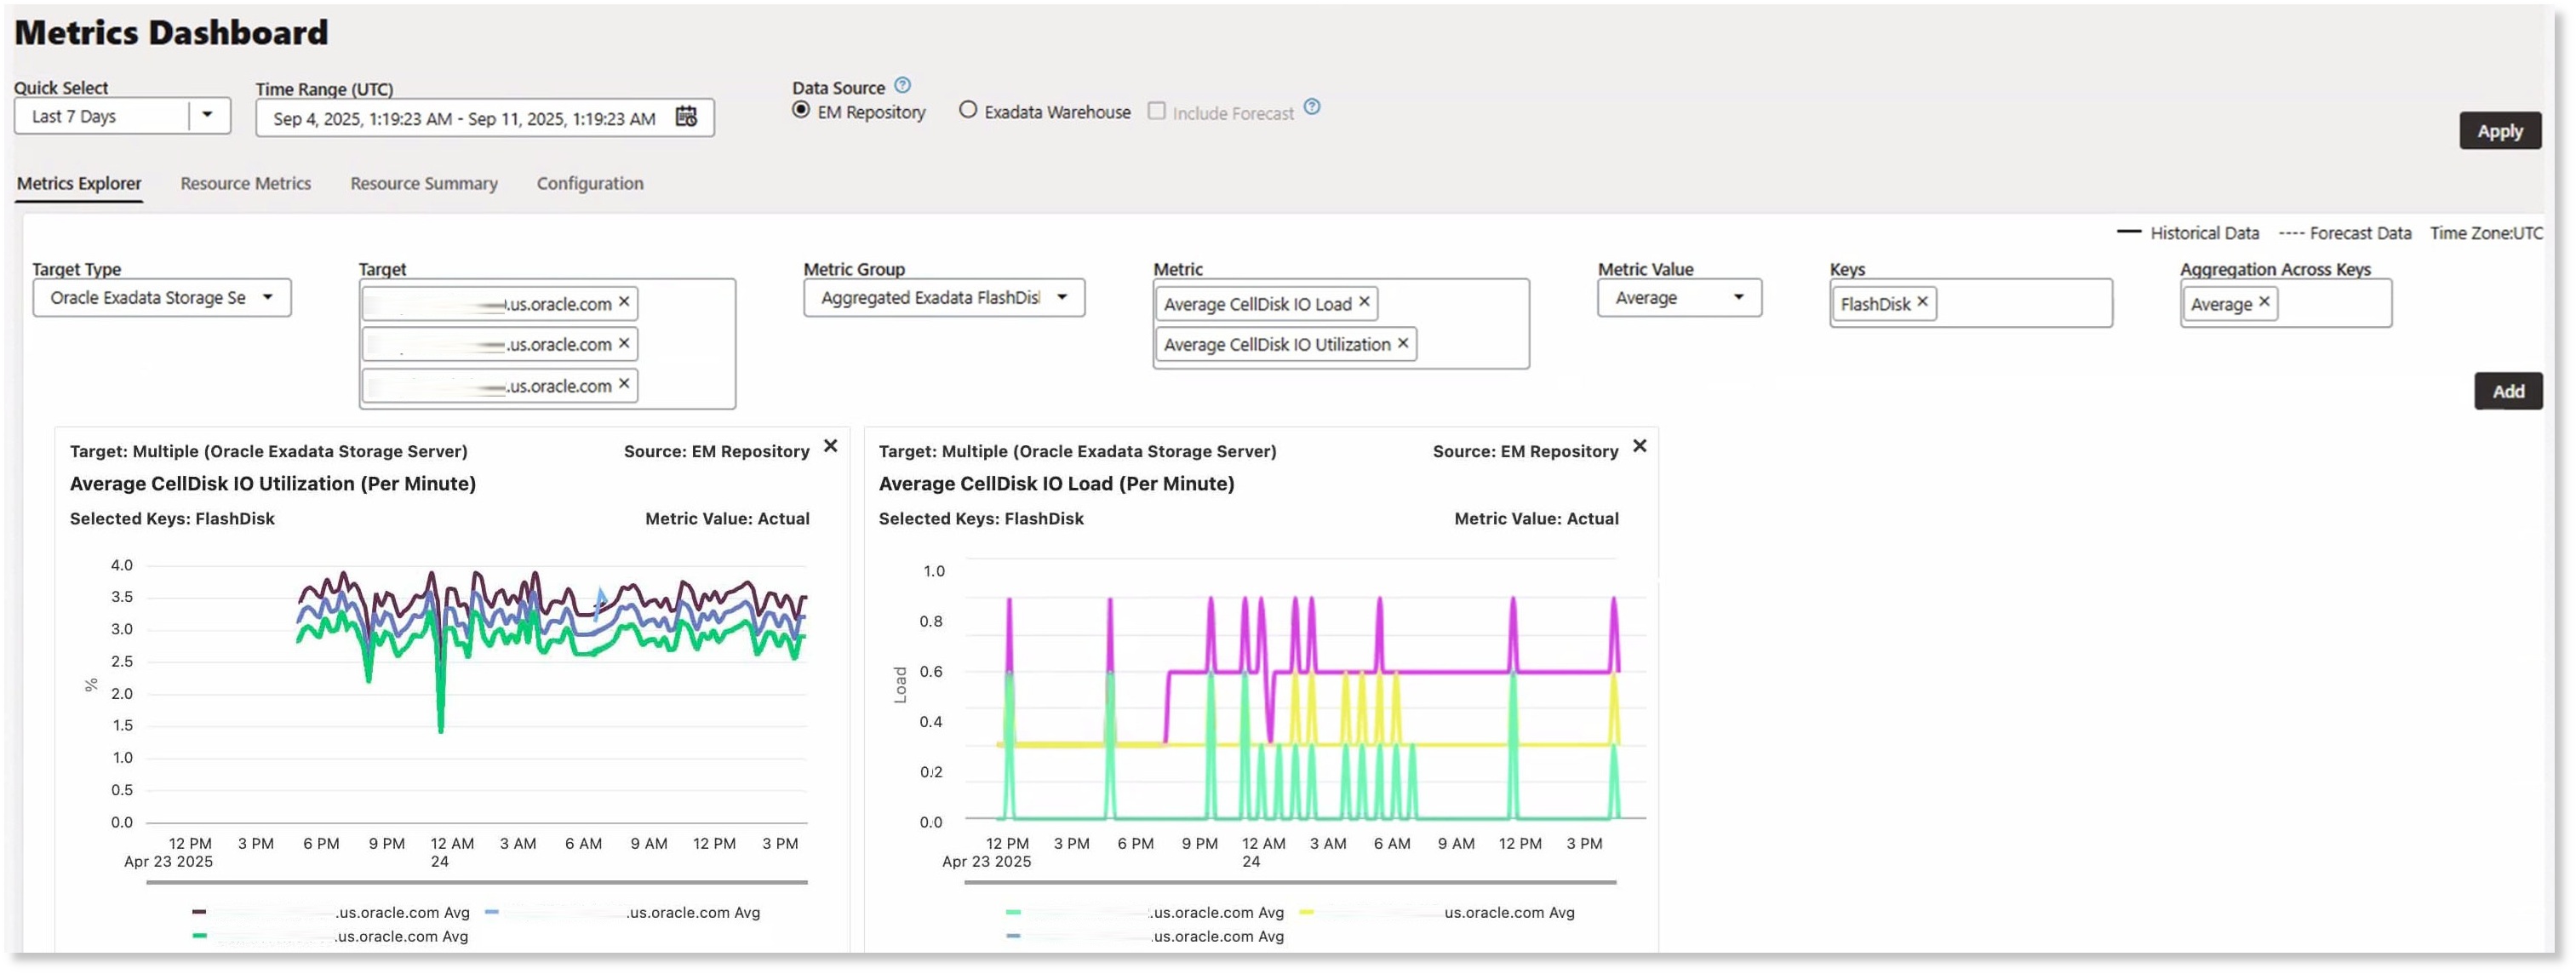
The Metrics Explorer tab allows customized visualization of key Exadata hardware (host and storage server) and software (Automatic Storage Management) components. For Recovery Appliance, it also includes key storage location and protected database storage metrics.
The visualizations can be generated by selecting the appropriate options in the following fields:
- Target Type: The target type of the Exadata hardware or software component for which metrics will be displayed.
- Target: One or more targets of the specified type.
- Metric: One or more metric columns from among a curated set of available metrics for the specified target type.
- Metric Value: The metric value to be used for the display: Average, Minimum, or Maximum. When the data source is Exadata Warehouse, then an additional option of 95th Percentile is available.
- Keys: The metric keys, if applicable to the selected metrics, for example, storage cell name and database name.
- Aggregation Across Keys: If multiple keys are specified and you want to plot aggregated values across those keys, this specifies the aggregation method.
After selecting the options, click Add to render line charts based on those selections. You can create additional charts by changing any of the options and clicking Apply; this will generate new charts reflecting the updated options. Previously rendered charts remain visible until they are deleted by clicking the X in the upper-right corner of the chart.
The image below displays data for the Average Cell Disk IO Utilization metric for three storage servers in an Exadata system. In the first chart, since no option was selected in the Aggregation Across Keys field, separate lines for each storage server are displayed. Subsequently, the Average Cell Disk IO Load metric was specified for the same three storage servers and Aggregation Across Keys was set to Average. This results in a second chart with a single line representing the aggregated value across the three storage servers.

The granularity of the data displayed is determined by the chosen time range, as follows:
- Last 1 Day: Finest granularity available. For Exadata Warehouse, some metrics may be available at per-minute granularity. For EM Repository, data is displayed according to the collection frequency specified for the metric.
- Last 7 Days: One data point per hour. For example, a time range of Last 7 Days and a Metric Value of Average, plots hourly averages of all the data points. For a more specific example, the EM Storage Server I/O Load metric has 15-minute collection frequency, while the Exadata Warehouse has data collected per minute for the same metric. For Exadata Warehouse, the hourly average is computed over the per-minute data. For EM Repository, the hourly average is computed over the data collected every 15 minutes.
- Last 30 Days: One data point per hour (same methodology as Last 7 Days).
- Older than 30 Days: One data point per day.
- Custom Time Period
- Between 2-30 days: One data point per hour.
- Older than 30 days: One data point per day.
For Recovery Appliances, the following additional metrics are available:
- Number of Protected Databases
- Used Space (GB)
- Unused Space (GB)
- Recovery Window Space (GB)
- Size (GB)
Resource Metrics
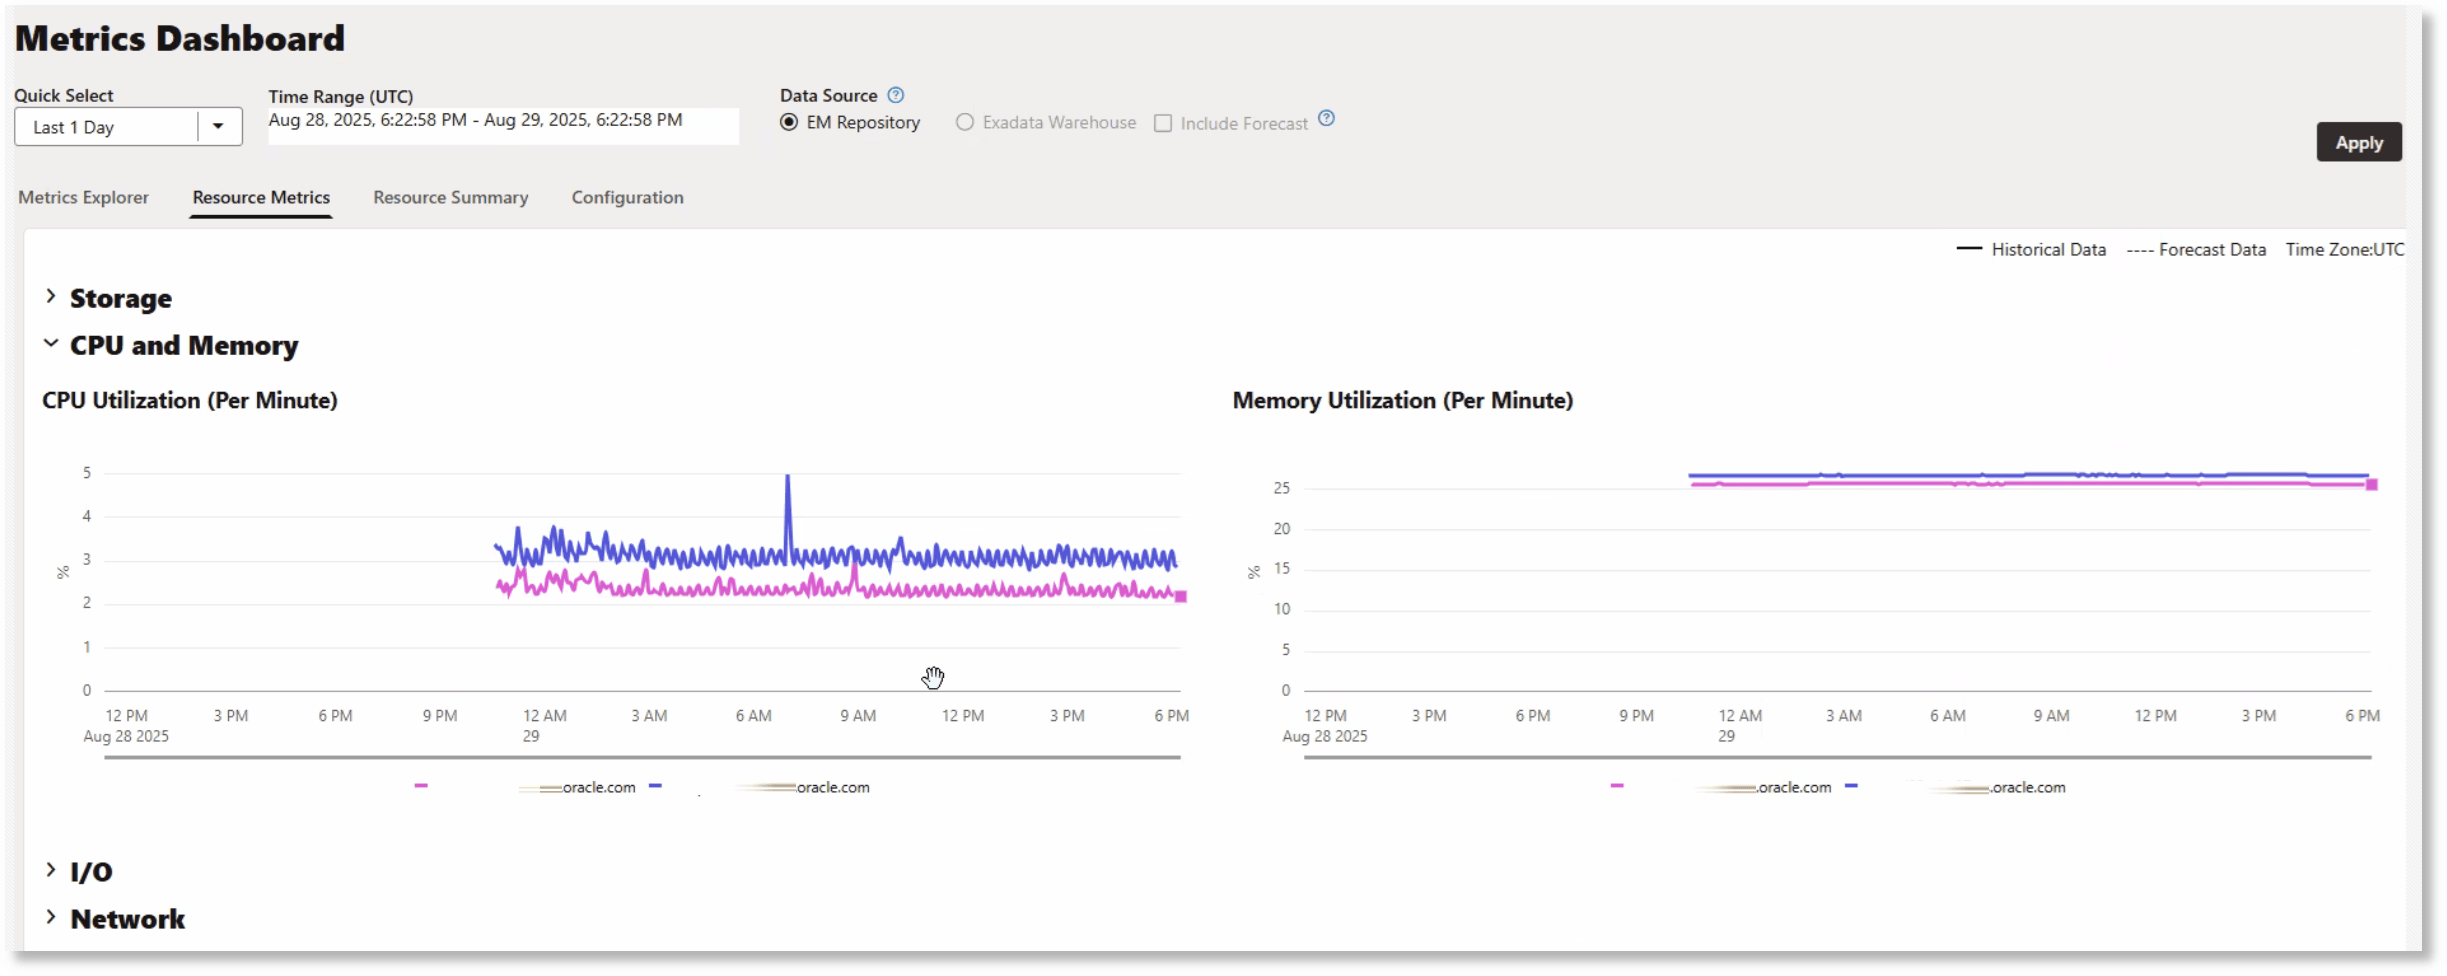
The Resource Metrics tab provides a time-aligned visualization of key metrics to help analyze concurrent behavior of Storage, CPU and Memory, I/O, and Network. This tab provides a comprehensive overview of resource utilization, making it easier to spot trends, bottlenecks, and correlations across different components within the Engineered System.

Resource Summary
The Resource Summary tab provides an overview of resource consumption over the past 24 hours, week, month, and year. There are separate sections for CPU and Memory, Network Interfaces - MB/s, and Current Space Usage by Disk Groups. The data on this tab can be used to analyze capacity and aid in planning future resource requirements.
Here are a few examples of how to use the data on this tab in conjunction with the specific metric data on the Metrics Explorer tab:
- A consistent average CPU and memory usage across these periods may indicate a steady workload throughout the year, while significant fluctuations in maximum values can help identify periods of peak system activity. In the latter case, specific metric data for the relevant time periods can be examined on the Metrics Explorer tab.
- To evaluate whether an Exadata system has enough storage to accommodate more databases or has the storage capacity to handle upcoming load, the Current Space Usage by Disk Groups section indicates how Automatic Storage Management (ASM) is being used on the storage servers. Further investigation of historical space usage trends can be performed on the Metrics Explorer tab by choosing Cluster ASM in the Target Type field, and selecting one or more space-related metrics.
