2 Deployment Model
The deployment model has the following four major components:
- OCI Infrastructure
- User Management
- OCI Adaptor
- OCI Observability and Management
- Application (Cloud Native Core Network Functions, cnDBTier, CNC Console)
The following diagram represents the deployment of Network Functions (NFs) on OCI:
Figure 2-1 Deployment of Network Functions (NFs) on OCI
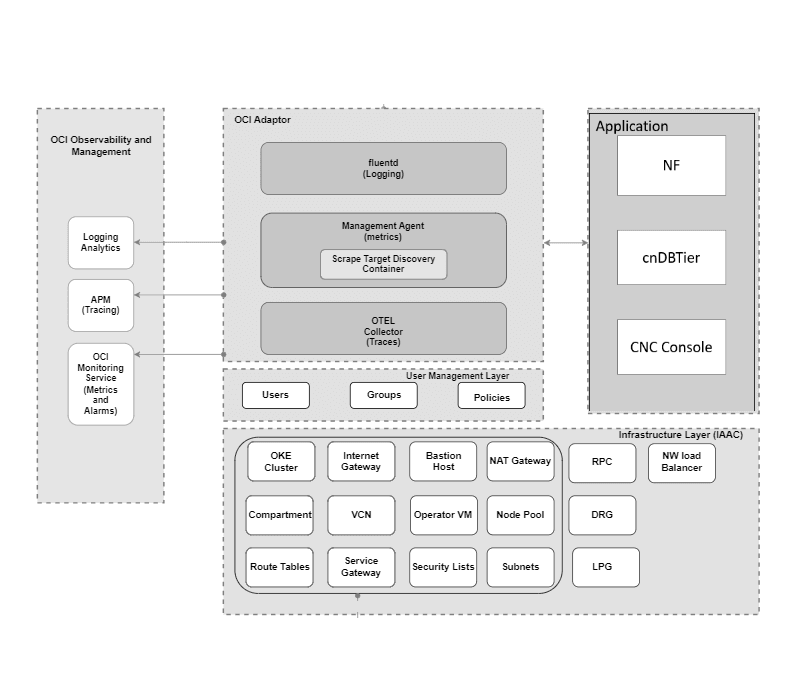
Note:
- OCI Adaptor and NF Applications (NFs, cnDBTier, and CNC Console) are deployed as a single OKE Cluster.
- The user must have OCI Tenancy and CNC NFs with OCI Adaptor to deploy the CNC NF on the OCI.
- The user can create a new compartment or use an existing compartment to deploy the OCI components.
Oracle Cloud Infrastructure
OCI provides high-performance computing capabilities (such as physical hardware instances) and storage capacity in a flexible overlay virtual network that is securely accessible from your on-premise network.
OCI infrastructure consists of Compartments, a Network Load balancer, a Bastion Host, a Dynamic Routing Gateway (DRG), a Remote Peering Connection (RPC), a Service Gateway, an Internet Gateway, and an OKE cluster, all in an OKE Virtual Cloud Network.
For creating the infrastructure layer, refer to Creating OCI Infrastructure section.
OKE Cluster
Oracle Kubernetes Engine (OKE) offers a carrier-grade container orchestration platform (based on Kubernetes) that supports the deployment requirements of cloud-native, containerized applications.
OKE is a fully managed and scalable service designed for deploying containerized applications in the cloud. It ensures high availability and reliability of cloud native applications. OKE utilizes Kubernetes to automate the deployment, scaling, and management of containerized applications.
OKE provides two types of clusters:
- Basic cluster: Basic clusters support all the core functionalities provided by Kubernetes and Container Engine for Kubernetes, but none of the enhanced features that Container Engine for Kubernetes provides. Basic clusters have a Service Level Objectives (SLOs) but not financially backed Service Level Agreements (SLAs).
- Enhanced cluster: Enhanced clusters support all the available features, such as virtual nodes, cluster add-on management, workload identity, and additional worker nodes per cluster. They also come with financially backed Service Level Agreements (SLAs).
For more details, refer to OKE Cluster and Enhanced Clusters and Basic Clusters.
Compartment
A compartment is a logical resource that helps achieve security isolation and controls resource access. CNC utilizes this resource to group CNC NF and its corresponding OCI resources and assigns users/groups with policies to access these resources, thus isolating access from the rest of the OCI Tenancy's users/groups.
For more details, refer to Managing Compartments.
Virtual Cloud Network
VCN is a networking service that helps create and manage a customizable and private network in the OCI cloud. A VCN service includes subnets, route tables, and security lists. CNC NF on OCI uses separate subnets for Bastion VM, Operator VM, Worker Nodes, and so on. Security lists define the Ingress and Egress rules for a subnet. Route tables assist in routing to a different network through gateways, such as sending CNC NF metrics data to the OCI Monitoring service.
For more details, refer to VCN Overview.
Network Load Balancer
The OCI Network Load Balancer (NLB) provides flexible automated traffic distribution from one entry point to multiple backend servers in your VCN. It operates at the connection level and load balances incoming client connections to healthy backend servers based on Layer 3/Layer 4 (IP protocol) data.
- oci-network-load-balancer.oraclecloud.com/internal
- oci-network-load-balancer.oraclecloud.com/security-list-management-mode
- oci-network-load-balancer.oraclecloud.com/subnet
- oci.oraclecloud.com/load-balancer-type
For more details, refer to Network Load Balancer.
Dynamic Routing Gateway
A Dynamic Routing Gateway (DRG) acts as a virtual router, providing a path for traffic to flow between your on-premise networks and VCNs and can also route traffic between VCNs. CNC NF uses OCI DRG to send and receive messages to NFs residing on the customer's on-premise network and towards NFs residing in a different OCI Region. Each DRG attachment has an associated route table to route packets entering the DRG to their next hop.
For more details, refer to DRG documentation.
Bastion Host
Bastion Hosts allow authorized users to connect from specific IP addresses to target resources using SSH sessions. Connected users can interact with the target resource using any software or protocol supported by the SSH.
For more details, refer to Bastion Overview.
Operator VM
The Operator VM is a private VM that connects to the OKE Cluster. It allows
you to perform user operations and run all kubectl commands. The user
can log into the operator VM only through the Bastion Host, which is a public VM. The
Operator VM uses OCI's instance principle mechanism to authenticate itself with the OKE
cluster.
For more details, refer Instance Principals.
The Terraform scripts create a dynamic group, which allows the Operator VM to use the Instance Principal Mechanism to authenticate itself with the following matching rule and policy. For more information about the Terraform scripts, see Terraform Scripts for OCI Deployment.
Matching Rule
All {instance.compartment.id='COMPARTMENT_ID', tag.OPERATOR_VM's_TAG='true'}
Policy
Allow dynamic-group DYNAMIC_GROUP_NAME to manage cluster-family in compartment COMPARTMENT_NAME
Node Pool
An OCI node pool is a group of nodes within a cluster that have the same configuration, such as a Linux image, number of OCPUs, RAM per node, boot volume, the applicable K8s version, and so on. CNC uses this node pool to create compute for the NFs. The advantage of this node pool is that a new compute is created with the same attributes when it is resized.
For more details, refer to OKE Node Pool.
Service Gateway
The service gateway provides access from a VCN to other OCI services, such as Oracle Cloud Infrastructure Object Storage. CNC uses Service Gateway to share metrics towards OCI Monitoring Services, share logs towards OCI Logging and Analytics and traces towards OCI APM data collector. The traffic from the VCN to the Oracle service does not use the internet. It uses the Oracle network fabric.
For more details, refer to Service Gateway.
User Management Layer
The user management layer allows you to create user groups and policies in a domain. There can be multiple identity domains in a tenancy:
- Default domain: Available by default and should only have limited number of admins who have administrative privileges on the tenancy level.
- Non-Default domains: All other application users.
There are three types of user groups:
- Tenancy Admin
- Compartment Admin
- Non-Admin Users
OCI Adaptor
The OCI Adaptor acts as a channel to transfer information between the application and OCI observability management. It assists CNC NFs in achieving observability and monitoring functions on the public cloud OCI platform.
- Fluentd: It is a open source data collector software to collect log data.
- Management Agent, Scrape Target Discovery Container, and Metric
Server are the components used to derive metrics.This component consists of the
following sub-components:
- OCI Management Agent
- Scrape Target Discovery Container
- Metric server
- OpenTelemetry (OTEL) Collector: OpenTelemetry (OTEL) Collector is the component to collect traces. To deploy the OCI Adaptor, see Deploying OCI Adaptor.
Fluentd
OCIs customized Fluentd is responsible for collecting the log data from the input sources, transforming the logs, and routing the log data to the OCI LA service.
For more details, refer to Fluentd.
Matching Rule:
ALL {instance.compartment.id = '<CNC NF's compartment_ocid>'}
Policy:
Allow dynamic-group DYNAMIC_GROUP_NAME to {LOG_ANALYTICS_LOG_GROUP_UPLOAD_LOGS} in compartment COMPARTMENT_NAME
For more details, refer to Managing Dynamic Groups.
Management Agent, Scrape Target Discovery Container, and Metric Server
This section provides the information about the management agent, scrape target discovery container, and metric server. This is used for metrics.
Management Agent
The Management Agent is the central entity that collects metrics data from different services and sources that need to be monitored and uploads it into the OCI Monitoring Service over the REST interface.
For more details, refer to Management Agents.
A dynamic group is created that allows the management agent to upload metrics data to OCI's metric monitoring service using the Terraform scripts based on the following matching rule and policy. For more information about the Terraform scripts, see Terraform Scripts for OCI Deployment.
Matching Rule:
ALL {resource.type='managementagent', resource.compartment.id='<AGENT_COMPARTMENT_OCID>'}
Policy:
allow dynamic-group DYNAMIC_GROUP_NAME to use metrics in compartment <PROMETHEUS_METRIC_COMPARTMENT_NAME>OTEL Collector
OpenTelemetry (OTEL) is an observability framework which is used to capture and export metrics, logs, and traces. CNC applications use OpenTelemetry to create spans or traces. A trace is a collection of spans connected in a parent child relationship. The traces specify how APIs or requests are propagated through the microservices and other components. OpenTelemetry Collector is used to collect traces from the NFs and send them to OCI Application Performance Monitoring (APM).
For more information about APM, see Application Performance Monitoring (APM) (Tracing).
OCI Observability and Management
The OCI Observability and Management service provides dashboards and explorers for observing the metrics, logs, and traces of CNC Applications. These dashboards and explorers allow you to view, query, and study metrics, logs, and traces.
The Observability and Management module includes:
- OCI Monitoring Service (Metrics and Alarms)
- Application Performance Monitoring (APM) (Tracing)
- Logging Analytics
Integration of OCIs observability and management with NF applications is achieved using OCI Adaptor.
Logging Analytics
OKE cluster environment on a OCI tenancy comprises of three tiers from which logs are generated:
- Infrastructure tier comprising of worker nodes, networking resources.
- Kubernetes platform tier comprising of Kubelet, Core DNS and so on.
- Application tier comprising of applications and DB applications.
Oracle Cloud Infrastructure (OCI) provides two logging services, namely OCI Logging and OCI Logging Analytics.
Oracle Cloud Logging Analytics (LA), a cloud solution in OCI assists in indexing, aggregating, visualizing, searching and also monitoring all log data from your applications and system infrastructure.
OCI Logging Analytics supports integration or log ingestion by applications using either Management Agent or Fluentd. However, OCI recommends log ingestion using Fluentd.
Figure 2-2 Fluentd Plugin Architecture

The CNC shares logs towards OCI LA using Fluentd, the OCI LA is used to perform log analysis.
For more information, see the "Logging Analytics" section in Oracle Cloud Infrastructure Documentation.
Visualizing the Logs
The user can view the logs using the Log Explorer option in the Logging Analytics.
- Log in to OCI Console.
For more information, see the "Signing In to the OCI Console" section in Oracle Cloud Infrastructure Documentation.
- Open the navigation menu and click Observability and Management.
- Under Logging Analytics, Click Log Explorer. The Log Explorer screen appears.
- The user can customize the Logs view by choosing the Visualizations options.
For more information, see the "Visualize Data Using Charts and Controls" section in Oracle Cloud Infrastructure Documentation.
Application Performance Monitoring (APM) (Tracing)
The OCI Application Performance Monitoring (APM) is a service that provides deep visibility into the performance of applications and offers the ability to diagnose issues quickly. APM collects and processes the transaction instance trace data using Application Performance Monitoring data sources, open source tracers, or directly using API. It accepts OpenTelemetry spans and combines them into traces. CNC Applications microservices share spans or traces towards the OCI APM that help troubleshoot the application.
CNC Applications use OpenTelemetry to create spans or traces. A trace is a collection or list of spans connected in a parent or child relationship.
Traces specify how APIs or requests are propagated through the microservices and other components, assisting operations and developers in troubleshooting issues in a customer deployment.
OCI Application Performance Monitoring (APM) provides a comprehensive set of features to monitor applications and diagnose performance issues.
Figure 2-3 Trace Collection towards OCI APM Data Collector

Monitoring the Traces
The user can monitor the traces using the Trace Explorer option in the Application Performance Monitoring service.
- Log in to OCI Console.
For more information, see the "Signing In to the OCI Console" in Oracle Cloud Infrastructure Documentation.
- Open the navigation menu and click Observability and Management.
- Under Application Performance Monitoring, click Trace Explorer.
- The Tracing Explorer screen appears.
- The user can customize the view of traces view by choosing the different options available.
For more information, see the "Monitor Traces in Trace Explorer" section in Oracle Cloud Infrastructure Documentation.
OCI Monitoring Service (Metrics and Alarms)
Management Agent of OCI Adaptor fetches metrics from the scrape targets and publishes them towards the OCI Monitoring Service.
Figure 2-4 OKE Cluster Monitoring with Management Agent

The Oracle Cloud Infrastructure (OCI) Monitoring service actively and passively monitors NF applications and cloud resources using the metrics and alarms features. CNC shares metrics with the OCI Monitoring service. These metrics help render various dashboards on OCI that eventually help monitor the CNC Applications. These metrics also assist in generating alerts for the customer. The management agent collects the metrics data from different services and sources that have to be monitored and uploads it to the OCI Monitoring Service.
For more information, see the "Monitoring" section in Oracle Cloud Infrastructure Documentation.
Note:
To view metrics and create the alarms, write the metrics queries using the Monitoring Query Language (MQL) syntax.For more information, see the "Monitoring Query Language (MQL) Reference" section in Oracle Cloud Infrastructure Documentation.
Viewing the Metrics
The user can view the metrics using the Metrics Explorer option in the OCI Monitoring Service.
To access the metrics explorer:
- Log in to OCI Console.
For more information, see "Signing In to the OCI Console" section in Oracle Cloud Infrastructure Documentation.
- Open the navigation menu and click Observability and Management.
- Under Monitoring, click Metrics Explorer. The Metrics Explorer screen appears.
- The user can customize the metrics view by choosing the customizations options.
For more information, see the "Creating a Basic Query" section in Oracle Cloud Infrastructure Documentation.
Creating the Alarms or Alerts
The user can create the alarms using the OCI Monitoring Service.
For more information, see the "Configuring NF Alerts on OCI" section in Oracle Communications Cloud Native Core, OCI Deployment Guide.
Creating the Alarms
The user can create the alarms in the OCI Monitoring Service.
- Log in to OCI Console.
For more information, see the "Signing In to the OCI Console" section in Oracle Cloud Infrastructure Documentation.
- Open the navigation menu and click Observability and Management.
- Under Monitoring, click Alarm Definitions.
- Click Create Alarm. The Create Alarm page opens in
Basic mode (the default view).
The following steps describe how to create an alarm in Basic mode:
- Enter a user-friendly name for the alarm. This name is sent as the title for notifications related to this alarm.
- For Alarm severity, select the perceived type of response required when the alarm is in the firing state.
- For Alarm body, provide user-readable notification content.
- The user can customize the alarms by choosing the provided customizations options.
For more information, see the "Managing Alarms" section in Oracle Cloud Infrastructure Documentation.
Creating a Custom Dashboard on OCI
The user can create custom dashboards on OCI, such as the APM dashboard for visualizing the traces and the Logging Analytics dashboard for visualizing the logs and metrics.
For more information, see the "Create a Custom Dashboard", "Create a Query-based Widget Using Metrics" and "Create a Query-based Widget Using Traces" sections in Oracle Cloud Infrastructure Documentation.
The user can export a custom dashboard, widgets, and filters and import it to a different tenancy or region.
For more information, see the "Export and Import Dashboards" section in Oracle Cloud Infrastructure Documentation.
Note:
- Logging Dashboard: Displays the Kubernetes Workloads, Kubernetes Cluster Summary, Kubernetes Nodes, Kubernetes Pods.
- Metric Dashboard: This is a sample Kubernetes Monitoring dashboard. It is a part of the Logging Analytics dashboard.
- APM or Tracing Dashboard: This is a sample APM or Tracing dashboard. It is part of the APM dashboard.
By default, sample dashboards for logging, tracing, and metrics are created as part of OCI Adaptor terraform scripts. The user can refer to the sample dashboards to create personalized dashboards.
The sample APM or Tracing dashboard is located as part of APM dashboards. Metric and Logging dashboards are located as part of Logging Analytics dashboards.
For more information, see the "OCI Monitoring Service" section in Oracle Communications Cloud Native Core, OCI Adaptor User Guide.