2 Maintenance
This chapter provides maintenance information, problem detection description, and general recovery procedures for the E5-APP-B.
Introduction
This chapter provides preventive and corrective maintenance information. Customers perform a small number of daily preventive maintenance tasks. The ELAP application performs automatic monitoring and problem reporting.
Detailed information about recovery procedures is contained in the remaining chapters of this manual.
Preventive Maintenance
This section describes the following recommended periodic maintenance:
-
Daily maintenance procedures:
Daily Maintenance Procedures
Use the Automatic PDB/RTDB Backup feature to backup all data stored in the PDB/RTDB. The manual backup procedures are included in this section in case the database backup needs to be performed manually. Storing database backups in a secure off-site location ensures the ability to recover from system failures.
This section describes the following recommended daily maintenance procedures:
Backing Up the RTDB
For ELAP 8.0 or later, a daily RTDB backup is created automatically. For automatic RTDB Backup, see Automatic RTDB Backup.
- From the ELAP menu, select .The window in Figure 2-1 is displayed.
Figure 2-1 Backup the RTDB
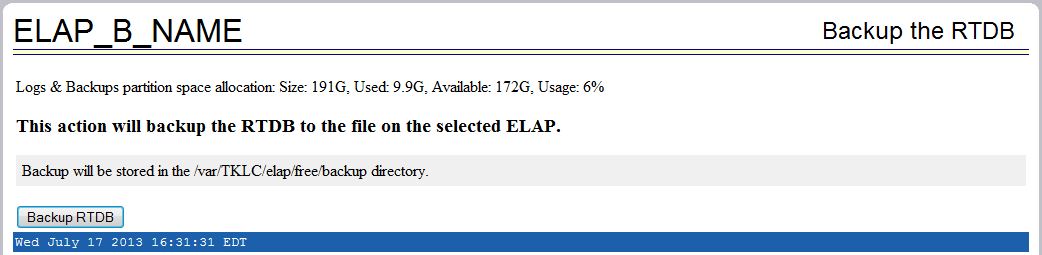
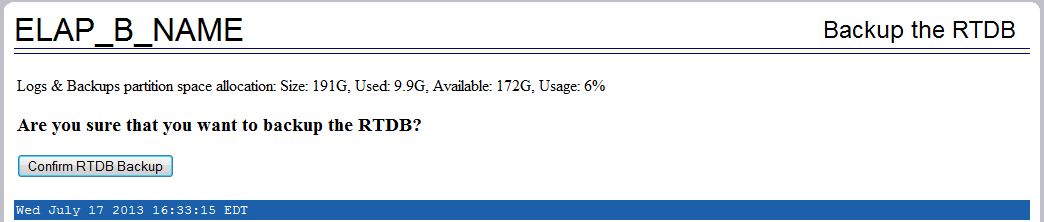
- Click Backup RTDB. The window in Figure 2-2 displays a request for confirmation.
Figure 2-2 Backup the RTDB Confirmation
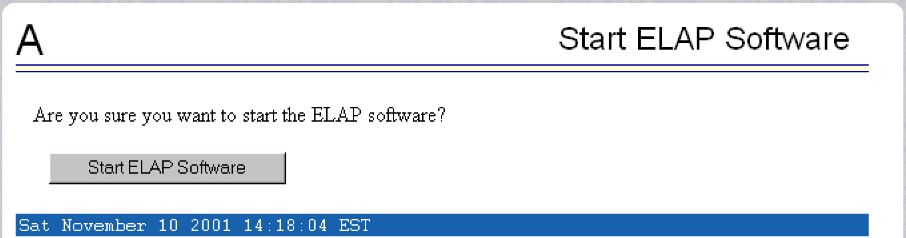
- On the Start ELAP Software screen as shown in Figure 2-3, click Start ELAP Software.
Figure 2-3 Start ELAP Software
 After the ELAP software has started successfully, the screen in Figure 2-4 is displayed.
Figure 2-4 Start ELAP Software - Success

- Click the Enable LSMS Connection button to enable the LSMS connection. Figure 2-5 shows the Change LSMS Connection Allowedwindow with the LSMS connection disabled.
Figure 2-5 Change LSMS Connection Allowed
 After the LSMS Connection is successfully enabled, the screen in Figure 2-6 is displayed.
Figure 2-6 Successfully Enabled LSMS Connection

Transferring RTDB Backup File
Perform this procedure once each day. The estimated time required to complete this procedure depends on network bandwidth. File sizes can be several gigabytes for the database.
- Log in to the ELAP command line interface with user name
elapdevand the password associated with that name. - Use the Secure File Transfer Protocol (
sftp) to transfer to a remote, secure location the RTDB backup file created by the procedure Backing Up the RTDB.
Automatic RTDB Backup
User Interface
The menu item circled in the following image is available on the ELAP GUI of the Active ELAP server only:
Figure 2-7 Automatic RTDB Backup Menu Item

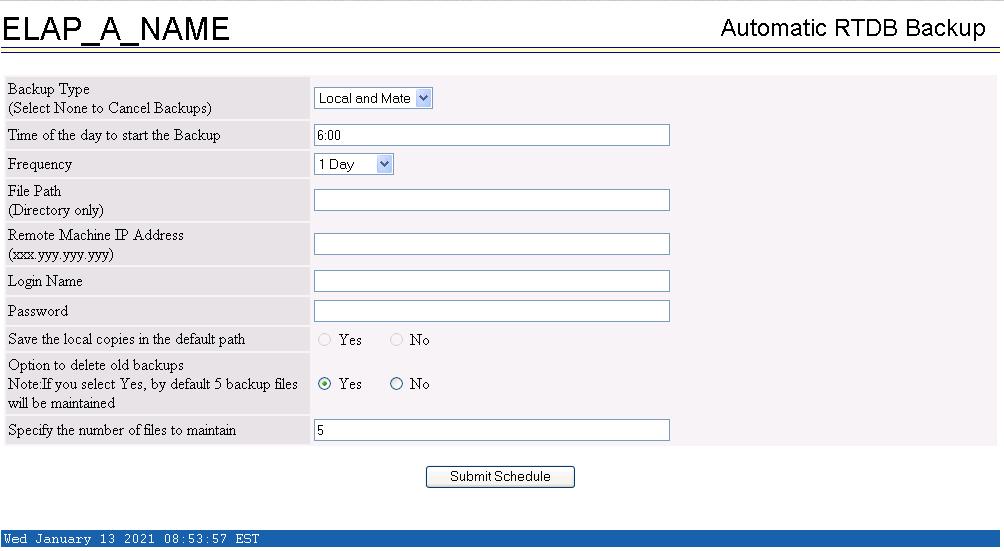
Clicking Automatic RTDB Backup opens the page shown in Figure 2-8.
Figure 2-8 Automatic RTDB Backup GUI Screen
- Local
- Mate
- Local and Mate
- Remote
- None
By default, backups shall be stored on both local and mate ELAP servers. If Automatic RTDB Backup is not configured, "None" option will not be available in the Backup Type field.
Note:
The following semantic rules must be followed:- Time of day must be in hh:mm 24-hour format. Example: 14:03
- File path (in remote only) must be the absolute path from root
- IP address must be in xxx.yyy.zzz.aaa format. Example: 192.168.210.111
- Password entered will be displayed with asterisks (*)
Backup Type: Local
- Time of day to start Local Backup
- Frequency:
- 12 hours
- 1 day (daily)
- 2 days
- 3 days
- 5 days
- 7 days
Note:
Daily backup frequency is the default. Selecting an option other than 1 day prompts the user for reconfirmation of the backup frequency, as daily is the recommended frequency. - File path where the user can
provide the subdirectories created within the directory
"/var/TKLC/elap/free/backup/"
Note:
By default, Backup file is saved in the Default File path. - Option to delete old backups. When the user selects "yes," server will delete the old backups, except the latest number of backup files specified by the user in the "Specify the number of files to maintain" field. By default, 5 backup files are maintained. If this option is "yes," a maximum of 7 and minimum of 1 backup file may be maintained.
- Specify the number of files to maintain
Backup Type: Mate
- Time of day to start Backup
- Frequency (same configuration as Local)
- File path (same configuration as Local)
- Option to delete old backups (same configuration as Local)
- Specify the number of files to maintain
Backup Type: Local and Mate
- Time of day to start Backup
- Frequency (same configuration as Local)
- File path (same configuration as Local)
- Option to delete old backups (same configuration as Local)
- Specify the number of files to maintain
Backup Type: Remote
- Time of day to start Backup
- Frequency (same configuration as Local)
- File path, which includes the absolute path for storing the backup file. If the user provides a non-existent directory, the directory will not be created and transfer of RTDB Backup file to the Remote Machine will fail.
- IP address of the Remote Machine
- User Login
- User Password
- Save the local copies in the default path. When the user selects "yes," the server will also save the RTDB Backup files in the local machine.
Backup Type: None
Selecting the Backup Type "None" cancels all currently scheduled backups All items on the form will be disabled except the submit button.
System Health Check Overview
The server runs a self-diagnostic utility program called syscheck to monitor itself. The system health check utility syscheck tests the server hardware and platform software. Checks and balances verify the health of the server and platform software for each test, and verify the presence of required application software.
If the syscheck utility detects a problem, an alarm code is generated. The alarm code is a 16-character data string in hexadecimal format. All alarm codes are ranked by severity: critical, major, and minor. Alarm Categories lists the platform alarms and their alarm codes.
The syscheck output can be in either of the following forms (see Health Check Outputs for output examples):
- Normal— results summary of the checks performed by
syscheck - Verbose—detailed results for each check performed by
syscheck
The syscheck utility can be run in the following ways:
- The operator can invoke
syscheck:- From the ELAPGUI Platform Menu (see Accessing the ELAP GUI Interface). The user can request Normal or Verbose output.
- By logging in as a
syscheckuser (see Running syscheck Using the syscheck Login). Only Normal output is produced. - By logging in as admusr and using sudo to run syscheck on the command line (see Running syscheck from the Command line).
- By logging into the
platcfgutility and runningsyscheckin either Normal or Verbose mode. For more information, see 7.a.
-
syscheckruns automatically by timer at the following frequencies:- Tests for critical platform errors run automatically every 30 seconds.
- Tests for major and minor platform errors run automatically every 60 seconds.
Functions Checked by syscheck
Table 2-1 summarizes the functions checked by syscheck.
Table 2-1 System Health Check Operation
Health Check Outputs
System health check utility syscheck output can be either Normal (brief) or Verbose (more detailed), depending upon how syscheck was initiated. The following examples show Normal and Verbose output formats:
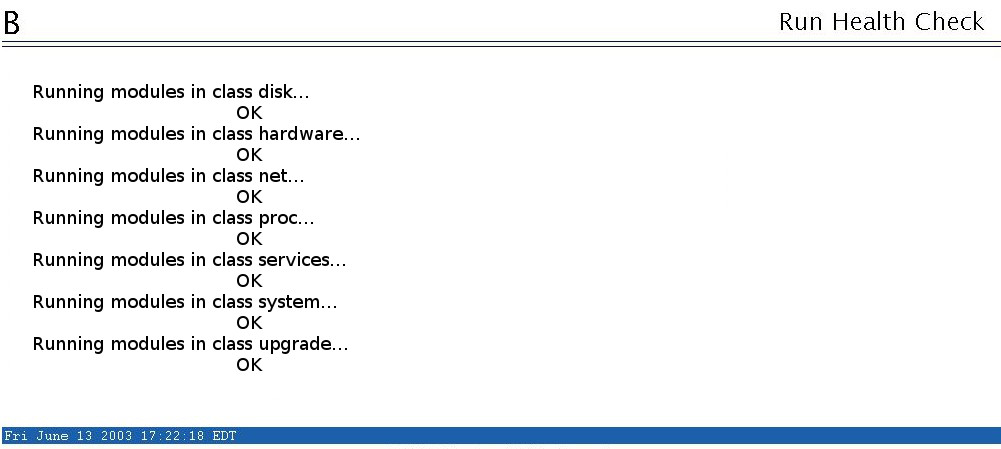
Normal Output
Running modules in class disk...
                                  OK
Running modules in class hardware...
                                  OK
Running modules in class net...
                                  OK
Running modules in class proc...
                                  OK
Running modules in class services...
                                  OK
Running modules in class system...
                                  OK
Running modules in class upgrade...
                                  OK
Verbose Output Containing Errors
If an error occurs, the system health check utility syscheck provides alarm data strings and diagnostic information for platform errors in its output. The following is an example of Verbose syscheck output:
Running modules in class disk...
         drbd: Checking DRBD status file, /proc/drbd
         drbd: line #1: DRBD version=[8.3.11]
         drbd: line #2 contains DRBD compilation info
         drbd: line #3: resource=[0]
         drbd: line #3: cs{0}=[Connected]
         drbd: line #3: st_self{0}=[Primary] st_peer{0}=[Secondary]
         drbd: line #3: ds_self{0}=[UpToDate] ds_peer{0}=[UpToDate]
         drbd: line #4 contains network stats
         drbd: processing alarms for resource=0
           fs: Current file space use in "/" is 43%.
           fs: Current Inode used in "/" is 14%.
           fs: Current file space use in "/boot" is 41%.
           fs: Current Inode used in "/boot" is 0%.
           fs: Current file space use in "/usr" is 57%.
           fs: Current Inode used in "/usr" is 20%.
           fs: Current file space use in "/var" is 34%.
           fs: Current Inode used in "/var" is 4%.
           fs: Current file space use in "/var/TKLC" is 40%.
           fs: Current Inode used in "/var/TKLC" is 1%.
           fs: Current file space use in "/tmp" is 0%.
           fs: Current Inode used in "/tmp" is 0%.
           fs: Current file space use in "/usr/TKLC/elap" is 6%.
           fs: Current Inode used in "/usr/TKLC/elap" is 0%.
           fs: Current file space use in "/var/TKLC/elap/drbd/mysql" is 4%.
           fs: Current Inode used in "/var/TKLC/elap/drbd/mysql" is 0%.
           fs: Current file space use in "/var/TKLC/elap/logs" is 0%.
           fs: Current Inode used in "/var/TKLC/elap/logs" is 0%.
           fs: Current file space use in "/var/TKLC/elap/free" is 3%.
           fs: Current Inode used in "/var/TKLC/elap/free" is 0%.
       hpdisk: Only HP ProLiant servers support hpdisk diagnostics.
          lsi: Could not find LSI controller. Not running test.
         meta: Checking md status on system.
         meta: md Status OK, with 3 active volumes.
         meta: Checking md configuration on system.
         meta: Server md configuration OK.
    multipath: No multipath devices configured to be checked.
          sas: Only T1200 supports SAS diagnostics.
        smart: Finished examining logs for disk: sdb.
        smart: Finished examining logs for disk: sda.
        smart: SMART status OK.
        write: Successfully read from file system "/".
        write: Successfully read from file system "/boot".
        write: Successfully read from file system "/usr".
        write: Successfully read from file system "/var".
        write: Successfully read from file system "/var/TKLC".
        write: Successfully read from file system "/tmp".
        write: Successfully read from file system "/usr/TKLC/elap".
        write: Successfully read from file system "/var/TKLC/elap/logs".
        write: Successfully read from file system "/var/TKLC/elap/free".
    Running modules in class hardware...
   cmosbattery: This hardware does not support monitoring the CMOS battery.
   cmosbattery: The test will not be ran.
          ecc: Checking ECC hardware.
          ecc: Correctible Error Count: 0
          ecc: Uncorrectible Error Count: 0
06/20/2016 05:11:30 EDT | inf | Discarding cache...
          fan: Checking Status of Server Fans.
          fan: Fan is OK. fana: 1, CHIP: FAN
          fan: Server Fan Status OK.
   fancontrol: EAGLE_E5APPB does not support Fan Controls
   fancontrol: Will not run the test.
   flashdevice: Checking programmable devices.
   flashdevice: PSOC OK.
   flashdevice: CPLD OK.
   flashdevice: BIOS OK.
   flashdevice: ALL Programmable Devices OK.
         mezz: Checking Status of Serial Mezzanine.
         mezz: Serial Mezzanine is OK. mezza: 1, CHIP: MEZZ
         mezz: Serial Mezzanine is OK. mezzb: 1, CHIP: MEZZ
         mezz: Server Serial Mezz Status OK.
        oemHW: Only Oracle servers support hwmgmt.
          psu: This hardware does not support power feed monitoring.
          psu: Will not run test.
          psu: This hardware does not support PSU monitoring.
          psu: Will not run test.
       serial: Running serial port configuration test
       serial: EAGLE_E5APPB does not support serial port configuration monitoring
       serial: Will not run test.
         temp: Checking server temperature.
         temp: Server Temp OK. Inlet Air Temp: +25.0 C (high = +70.0 C, warn = +66 C, hyst = +75.0 C), CHIP: lm75-i2c-0-48
         temp: Server Temp OK. Outlet Air Temp: +30.0 C (high = +70.0 C, warn = +66 C, hyst = +75.0 C), CHIP: lm75-i2c-0-49
         temp: Server Temp OK. MCH Diode Temp: +41.0 C (high = +95.0 C, warn = +90 C, low = +10.0 C), CHIP: sch311x-isa-0a70
         temp: Server Temp OK. Internal Temp: +26.8 C (high = +95.0 C, warn = +90 C, low = +10.0 C), CHIP: sch311x-isa-0a70
         temp: Server Temp OK. Core 0: +30.0 C (high = +71.0 C, crit = +95.0 C, warn = +67 C), CHIP: coretemp-isa-0000
         temp: Server Temp OK. Core 1: +24.0 C (high = +71.0 C, crit = +95.0 C, warn = +67 C), CHIP: coretemp-isa-0000
      voltage: Checking server voltages.
      voltage: Voltage is OK. V2.5: +2.44 V (min = +2.37 V, max = +2.63 V), CHIP: sch311x-isa-0a70
      voltage: Voltage is OK. Vccp: +1.04 V (min = +0.85 V, max = +1.35 V), CHIP: sch311x-isa-0a70
      voltage: Voltage is OK. V3.3: +3.27 V (min = +3.13 V, max = +3.47 V), CHIP: sch311x-isa-0a70
      voltage: Voltage is OK. V5: +4.97 V (min = +4.74 V, max = +5.26 V), CHIP: sch311x-isa-0a70
      voltage: Voltage is OK. V1.8: +1.81 V (min = +1.69 V, max = +1.88 V), CHIP: sch311x-isa-0a70
      voltage: Voltage is OK. V3.3stby: +3.28 V (min = +3.13 V, max = +3.47 V), CHIP: sch311x-isa-0a70
      voltage: Voltage is OK. V3.3: +3.29 V (min = +3.13 V, max = +3.46 V), CHIP: cy8c27x43-i2c-0-28
      voltage: Voltage is OK. V1.8: +1.81 V (min = +1.71 V, max = +1.89 V), CHIP: cy8c27x43-i2c-0-28
      voltage: Voltage is OK. V1.5: +1.50 V (min = +1.42 V, max = +1.57 V), CHIP: cy8c27x43-i2c-0-28
      voltage: Voltage is OK. V1.2: +1.20 V (min = +1.14 V, max = +1.26 V), CHIP: cy8c27x43-i2c-0-28
      voltage: Voltage is OK. V1.05: +1.04 V (min = +1.00 V, max = +1.10 V), CHIP: cy8c27x43-i2c-0-28
      voltage: Voltage is OK. V1.0: +1.00 V (min = +0.95 V, max = +1.05 V), CHIP: cy8c27x43-i2c-0-28
      voltage: Server Voltages OK.
Running modules in class net...
   defaultroute: Checking default route(s)
   defaultroute:   Checking static default route through device eth01 to gateway 192.168.61.250...
         ping: Checking ping hosts
         ping: prova-ip network connection OK
         ping: provb-ip network connection OK
         ping: dsmm-a network connection OK
         ping: dsmm-b network connection OK
         ping: dsmb-a network connection OK
         ping: dsmb-b network connection OK
         ping: sync-a network connection OK
         ping: sync-b network connection OK
                                  OK
Running modules in class proc...
          run: Checking RTCtimeStampd...
          run: Found 1 instance(s) of the RTCtimeStampd process.
          run: Checking ntdMgr...
          run: Found 1 instance(s) of the ntdMgr process.
          run: Checking smartd...
          run: Found 1 instance(s) of the smartd process.
          run: Checking switchMon...
          run: Found 1 instance(s) of the switchMon process.
          run: Checking atd...
          run: Found 1 instance(s) of the atd process.
          run: Checking crond...
          run: Found 1 instance(s) of the crond process.
          run: Checking snmpd...
          run: Found 1 instance(s) of the snmpd process.
          run: Checking sshd...
          run: Found 7 instance(s) of the sshd process.
          run: Checking syscheck...
          run: Found 1 instance(s) of the syscheck process.
          run: Checking rsyslogd...
          run: Found 1 instance(s) of the rsyslogd process.
          run: Checking tklcTpdCardCfgS...
          run: Found 1 instance(s) of the tklcTpdCardCfgS process.
          run: Checking alarmMgr...
          run: Found 1 instance(s) of the alarmMgr process.
          run: Checking tpdProvd...
          run: Found 1 instance(s) of the tpdProvd process.
          run: Checking trpd...
          run: Found 1 instance(s) of the trpd process.
          run: Checking prov...
          run: Found 1 instance(s) of the prov process.
          run: Checking ebdad...
          run: Found 1 instance(s) of the ebdad process.
          run: Checking hsopd...
          run: Found 1 instance(s) of the hsopd process.
          run: Checking maint...
          run: Found 1 instance(s) of the maint process.
          run: Checking exinit...
  run: Found 1 instance(s) of the syscheck process.
          run: Checking rsyslogd...
          run: Found 1 instance(s) of the rsyslogd process.
          run: Checking tklcTpdCardCfgS...
          run: Found 1 instance(s) of the tklcTpdCardCfgS process.
          run: Checking alarmMgr...
          run: Found 1 instance(s) of the alarmMgr process.
          run: Checking tpdProvd...
          run: Found 1 instance(s) of the tpdProvd process.
          run: Checking trpd...
          run: Found 1 instance(s) of the trpd process.
          run: Checking prov...
          run: Found 1 instance(s) of the prov process.
          run: Checking ebdad...
          run: Found 1 instance(s) of the ebdad process.
          run: Checking hsopd...
          run: Found 1 instance(s) of the hsopd process.
          run: Checking maint...
          run: Found 1 instance(s) of the maint process.
          run: Checking exinit...
          run: Found 1 instance(s) of the exinit process.
          run: Checking gs...
          run: Found 1 instance(s) of the gs process.
          run: Checking mysqld...
          run: Found 1 instance(s) of the mysqld process.
          run: Checking hamond...
          run: Found 1 instance(s) of the hamond process.
                                  OK
Running modules in class services...
   ha_keepalive: HA Keepalive Syscheck Test Start
   ha_keepalive: {   Broadcast        eth04              17401}: UP
   ha_keepalive: HA Keepalive Test Complete
   ha_transition: HA Transition Syscheck Test Start
   ha_transition: HA ACTIVE, no transition in progress.
   ha_transition: HA Transition Syscheck Test Complete
                                  OK
Running modules in class system...
         core: Checking for core files.
          cpu: Found "2" CPU(s)... OK
          cpu: CPU 0 is on-line... OK
          cpu: CPU 0 speed: 2660.017 MHz... OK
          cpu: CPU 1 is on-line... OK
          cpu: CPU 1 speed: 2660.017 MHz... OK
        kdump: Checking for kernel dump files.
          mem: Skipping expected memory check.
          mem: Minimum expected memory found.
          mem: 8252936192 bytes (~7871 Mb) of RAM installed.
                                  OK
Running modules in class upgrade...
    snapshots: No snapshots found. Not running test.
                                  OK
Running the System Health Check
The operator can run syscheck to obtain the operational platform status with one of the following procedures:
Running syscheck from the Command line
The admusr can use sudo to run syscheck from the command line. This method can be used whether an application is installed or whether the GUI is available.
Running syscheck Through the ELAP GUI
Refer to ELAP Administration and LNP Feature Activation for more details and information about logins and permissions.
- Check the banner information above the menu to verify that the ELAP about which system health information is sought is the one that is logged into.
Figure 2-9 Login Window

- When the GUI shows you are logged into the ELAP about which you want system health information, select Platform>Run Health Check. as shown in the following window.
Figure 2-10 Run Health Check
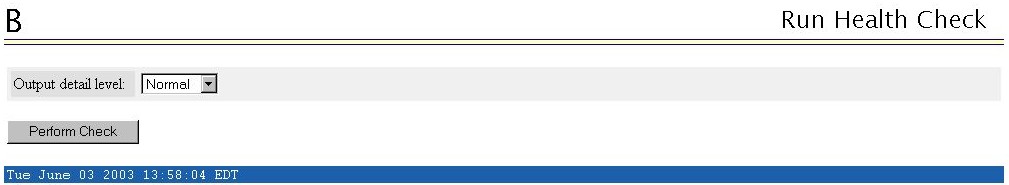
- Click the Perform Check button to run the system health check on the selected server.The system health check output data is displayed, as shown in Figure 2-11.
Figure 2-11 Displaying System Health Check on ELAP GUI
Running syscheck Using the syscheck Login
If the ELAP application has not been installed on the server or you are
unable to log in to the ELAP user interface, you
cannot run syscheck through the GUI. Instead, you can run
syscheck from the
syscheck login,
and report the results to My Oracle Support.
Configurable MySQL Password
From ELAP release 11.0.0.4.0 or later, customers are allowed to change the MySQL password.
MySQL Password Policy
The system enforces the following rules for MySQL password updates:
- Minimum length of 12 characters.
- Maximum length of 255 characters
- Must include at least one uppercase letter.
- Must include at least one lowercase letter.
- Must include at least one numeric digit.
- Must include at least one special character.
- Allowed special chars are ! # % * + - . / : = ? @ [ ] ^ _ { } ~
Passwords that do not meet these criteria will be rejected by the system during the update process.
Changing MySQL Password
Follow the steps below if current MySQL Password is known. If the password is not known contact My Oracle Support.
1. Determine whether ELAP-A or ELAP-B is the active server. Run the below
hastatus commands on both servers and check for the server showing
hastatus as active.
Example: [root@Arica-a ~]# hastatus
ACTIVE
2. Login to Active ELAP CLI as root user.
For information about how to log in to the ELAP CLI, see Connecting to the Server Command Line.
3. Navigate to the bin directory, execute the password change script (changePwd.pl) and provide valid inputs for prompts when asked.
Output:
[root@Arica-a ~]# bin
[root@Arica-a bin]# ./changePwd.pl
Enter current MySQL root password:<Current MySQL Password>
Enter new MySQL password:<New MySQL Password>
Confirm new MySQL password:<New MySQL Passsword>
Password updated successfully.
4.After Successful execution on the script, restart Elap service.
[root@Arica-a bin]# systemctl restart Elap
Login to MySQL with new password for verification.
[root@Arica-a bin]# mysql -uroot -p
Enter Password:<New Password>
Note:
If any error occurs during the password change process, the system automatically rolls back to the previous MySQL password, ensuring system stability and preventing partial updates.