2 Monitoring Orders
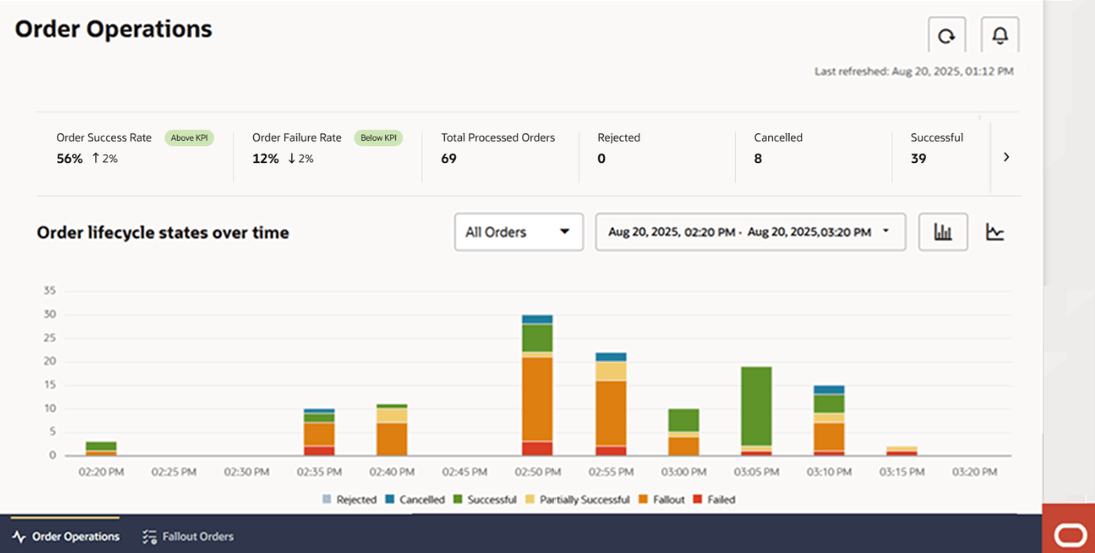
This chapter describes how to monitor orders using the Order Operations dashboard. Using the Order Operations dashboard, you can monitor order volumes in real-time. The dashboard provides information in the form of bar graphs and line graphs. It also highlights Key Performance Indicators and displays the number of orders that are in each life cycle state.
About the Order Operations Dashboard
On the landing page, click Order Operations to open the Order Operations dashboard.
Note:
The data in this image has been set up to showcase all the data facets that can be visible in the dashboard.Figure 2-1 Bar Chart in Order Operations Dashboard
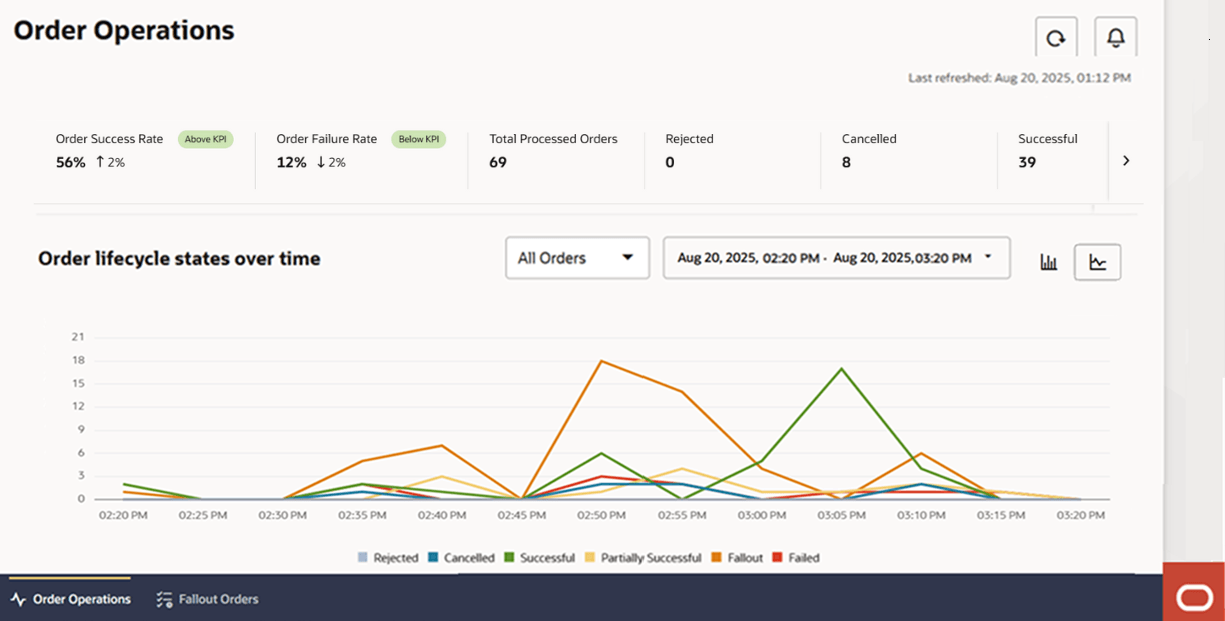
The following image shows the Order Operations dashboard, with the line graph selected.
Note:
The data in this image has been set up to showcase all the data facets that can be visible in the dashboard.Figure 2-2 Line Graph in Order Operations Dashboard
Note:
All metrics displayed on the dashboard are for TMF orders only.The dashboard shows real-time order status information for a specified duration and refreshes automatically after every 3 minutes, by default.
Clicking ![]() (Refresh icon) refreshes the data and displays the latest order status
information in real-time.
(Refresh icon) refreshes the data and displays the latest order status
information in real-time.
Clicking ![]() (Alerts icon) opens the Alerts panel, which displays alerts when a
threshold set on a specific order metric is reached. For example, by default, an alert
is generated and displayed every time the order success rate drops below 98%. See Viewing Alerts for further details about alerts.
(Alerts icon) opens the Alerts panel, which displays alerts when a
threshold set on a specific order metric is reached. For example, by default, an alert
is generated and displayed every time the order success rate drops below 98%. See Viewing Alerts for further details about alerts.
Key Performance Indicators
The dashboard displays the following key performance indicators about the orders OSM received:
-
Order Success Rate: This KPI represents the percentage (%) of the number of Completed Orders proportionate to the number of Total Processed Orders. When this percentage (%) drops below a threshold that you set, a down arrow and the percentage of the drop (as in a stock ticker) are displayed. By default, the threshold is set to 98%. The equation for calculating this KPI is as follows:
Order Success Rate = (Number of Completed Orders / Number of Total Processed Orders) x 100 -
Order Failure Rate: This KPI represents the percentage (%) of the number of Failed Orders proportionate to the number of Total Processed Orders. When this percentage (%) rises above a threshold that you set, an up arrow and the percentage of the rise (as in a stock ticker) are displayed. By default, the threshold is set to 2%. The equation for calculating this KPI is as follows:
Order Failure Rate = (Number of Failed Orders + Number of Rejected Orders) / Number of Total Processed Orders x 100 - Total Processed Orders: This is the total
number of orders that OSM has
processed.
Total Processed Orders = Rejected Orders + Cancelled Orders + Completed Orders + Partial Orders + Failed OrdersThis metric tracks the finished TMF states of orders:
- Completed – Order fully successful.
- Failed – Order fully unsuccessful.
- Partial – Order finished with mixed
results (some items succeeded, at least one
failed).
Note:
Partial does not mean that the order is in progress; it only applies once an order has finished with both successes and failures. - Rejected/Cancelled – Order ended without processing.
The KPIs are displayed for the orders that OSM received over the configured duration. The default duration is 6 months, but your administrator can modify this in the instance specification file.
Order Life Cycle States
The dashboard displays the numbers of orders that are in each life cycle state.
- Rejected: Represents the number of rejected
orders. An order could be rejected for the following
reasons:
- The order feasibility check failed.
- Invalid information is provided in the order request.
- The order request failed to meet the business rules for ordering.
- Cancelled: These are orders placed and then cancelled.
- Successful: These are fulfilled orders, for which services are provisioned. This state corresponds to the Completed TM Forum order state.
- Partially Successful: These are orders for which OSM has completed processing only some order line items, while other order line items haven't been fulfilled. This state corresponds to the Partial TM Forum order state.
- Fallout: These are orders that are in fallout.
- Failed: These are orders that couldn't be processed and fulfilled. This state corresponds to the Failed TM Forum order state.
These numbers are displayed for the orders that OSM processed over the configured duration. The default duration is 6 months, but your administrator can modify this in the instance specification file.
Bar Chart and Line Graph
Click ![]() (Bar Chart icon) to view the bar graph.
(Bar Chart icon) to view the bar graph.
Click ![]() (Line graph icon) to view the line chart.
(Line graph icon) to view the line chart.
Each colored block in the stacked bar chart and each colored line in the line graph represent orders in a specific life cycle state. These states are based on the TM Forum model for order life cycle states.
- Choose to view only product orders, only service orders, or both types of orders by using the drop-down list on the graph. By default, this field is set to All Orders.
-
Specify a duration for which you want to view the status of orders. By default, the duration is set to Today, which displays order volumes and their states for the current rolling hour.
To specify a duration, click the date range drop-down list on the graph, specify the duration of your choice, and then click Apply. The charts reflect the total number of orders in their current states in an interval-based counter (or equivalent) that reflects the total number over a defined interval period.
By default, you can choose to view order states for a maximum of 6 months and within the last 6 months.
Note:
The bar chart and the line graphs represent the number of orders transitioning into a particular state in the specified time period, and not the total number of orders currently in that state. - Hover over the colored blocks in the bar chart to view the value of the orders in that state.
- Use the colored checkboxes (squares) below the chart to hide or show the order states in the graph or chart.
- Refresh the data by clicking
 (Refresh icon) at the top.
Viewing Alerts
On the Operations Dashboard, click ![]() (Alerts icon) to open the Alerts panel.
(Alerts icon) to open the Alerts panel.
OSM generates alerts everytime the threshold set on a specific metric is reached within the last 24 hours. The last 24 hour period is calculated in a rolling window from the closest half an hour period.
- Orders submitted in an hour. An alert is raised when OSM receives more than a configured maximum number of orders in an hour. Every time this maximum is exceeded, an alert is generated. The default maximum number of orders is 5,000. The hour time period is calculated in a rolling window everytime the page is refreshed. If the threshold is breached in any rolling window, an alert will be raised. Since alerts are not stored, they appear based on the order data of that rolling window of an hour.
- Order completion success percentage. An alert is raised when the rate of successful order processing drops below a configured minimum threshold. Everytime this minimum is breached, an alert is generated. The default minimum threshold is 98%.
Your administrator can change these default values to your own values to set up and trigger alerts as per your organization's needs. For information about configuring alerts, see the chapter about setting up the Order Operations and Fallout Management GUI in OSM Cloud Native Deployment Guide.
To close the Alerts panel, click ![]() (Alerts icon) again.
(Alerts icon) again.

