Weekly Comparison Module
This module compares the customer's electricity costs during peak hours in the current week to their spending during peak hours in the previous week, and provides varying feedback based on how the customer's costs in the week compare to those of the previous week.
On this page:
Customer Requirements
|
Category |
Description |
|---|---|
|
Data Requirements |
AMI (hourly or more granular) data. |
|
Data History |
AMI data for the last two weeks. |
|
Data Coverage |
The default requirements are: 50% read coverage for the week covered by the report. 50% read coverage for the week preceding the report one. This product does not differentiate between estimated and non-estimated reads. Both types of reads are supported. |
Limitations
- Zero Usage: In the case when a customer hasn't used any electricity during the week, several checks are completed to determine whether to hide modules, or to fail the entire email communication. The checks are as follows:
- Introduction Email: If the Hourly Usage module has 0 usage, the module is excluded from the communicaiton.
- Weekly Email: If the Weekly Comparison module has 0 usages, the communication is not sent. If the Hourly Usage module has 0 usages, the module is excluded but the communication is sent.
- Peak Usage Summary Email: If the Hourly Usage module has 0 usages, the module is excluded from the communication.
- Emails Including the Season Transition Module: The Weekly Coach Email and the Peak Usage Summary Email can contain the Season Transition module. If the emails include the pre-transition version of the module and the Weekly Comparison module has 0 usages, the module is exclude from the communication. If the Hourly Usage module has 0 usages, the module is exclude from the communication.
-
Rates with no on-peak period in a given season: The module shows non-peak usage data when no on-peak time of use period is present. See the User Experience Variations.
User Experience
This module includes the following components:
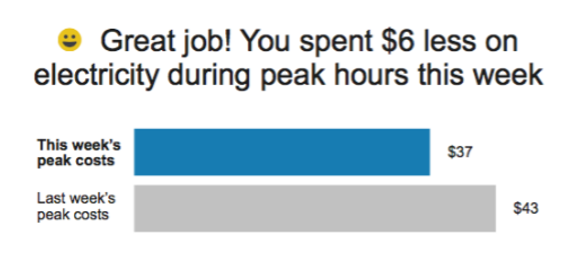
Insight Statement: A message above the graph that varies based on how the customer's costs in the week compare to those of the previous week. For example, if the customer spent less on energy in the current week, the message might say, "Great job! You spent [$X] less on electricity during peak hours this week." The message changes based on the customer's cost comparison. No filtering is performed to remove high or low usage outliers. Partial peak hours are not included in the comparison.
Insight Statement Graphic: A graphic appears next to the insight statement. If the customer used less energy during the current week than the previous week, the module displays a smiley face. If the customer used more energy, the module displays an exclamation point.
Bar Graph: The module includes a horizontal bar graph that compares the customer's energy costs during peak hours in the current week to their spending during peak hours in the previous week.
User Experience Variations
This section discusses the user experience variations in the Weekly Comparison module.
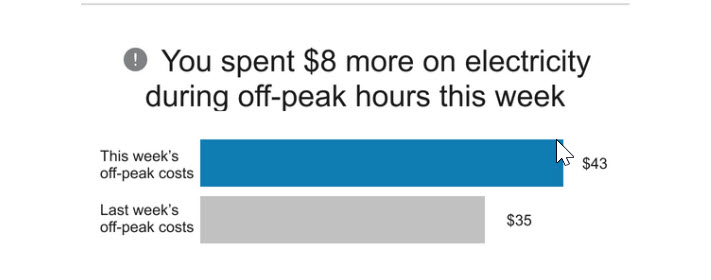
Customer Spent More This Week
If a customer spends more during peak hours this week, the TOU Coach Weekly Comparison module displays the following:
- Insight Statement: You spent [$X] more on electricity during peak hours this week.
- Insight Graphic: The module displays an exclamation point next to the insight statement.
Customer Spent About the Same This Week
If a customer spends about the same amount during peak hours this week, the TOU Coach Weekly Comparison module displays the following:
- Insight Statement: You spent about the same on electricity during peak hours this week.
- Insight Graphic: The module does not display a graphic next to the insight statement.
Usage Variation
If the email is designed to display usage instead of cost, the module displays the following:
- Insight Statement: You used <XX% more/less> electricity during peak hours this week
- Bar Labels: The labels to the left of the graph read "This week's peak usage" and "Last week's peak usage", and the labels to the right display the usage in kWh.
- Decimal Places for kWh: When displaying usage, you can configure the module to include up to two decimal places in the kWh display. For example, 4.25 kWh.
Data Overlapping the Seasonal Transition Date
Costs cannot be calculated for this module if the seasonal transition occurs within the module look back period. The behavior of the module is impacted by whether or not the peak hours data has changed.
Peak hours have changed: If peak hours changed at the season transition, and the look-back period for a given module overlaps the season transition date, then the module fails and the individual module is not included in the Time of Use Coach email type. The report will still be sent with the remaining modules.
Peak hours have not changed: If the customer's peak hours have not changed, one the following variations occurs:
- If peak hours have not changed in a period that overlaps the seasonal transition, the seasonal transition module is shown in usage form.
-
If peak hours have not changed in a period that overlaps the seasonal transition, and non-peak data for other data changing modules in the report have changed during the season transition date, then all of the report modules are shown in usage form. Costs are not calculated or shown.
Rates with Off-Peak and Partial-Peak Periods Only
The module automatically evaluates whether there is an on-peak period in the current rate plan. If there is no on-peak period in the current rate plan, the module will use part-peak data to show off-peak usage.
This variation is only applicable to the Weekly Comparison module and the Peak Usage Summary module. Disaggregation and bill period modules do not support an off-peak usage variation.