Demand Heatmap
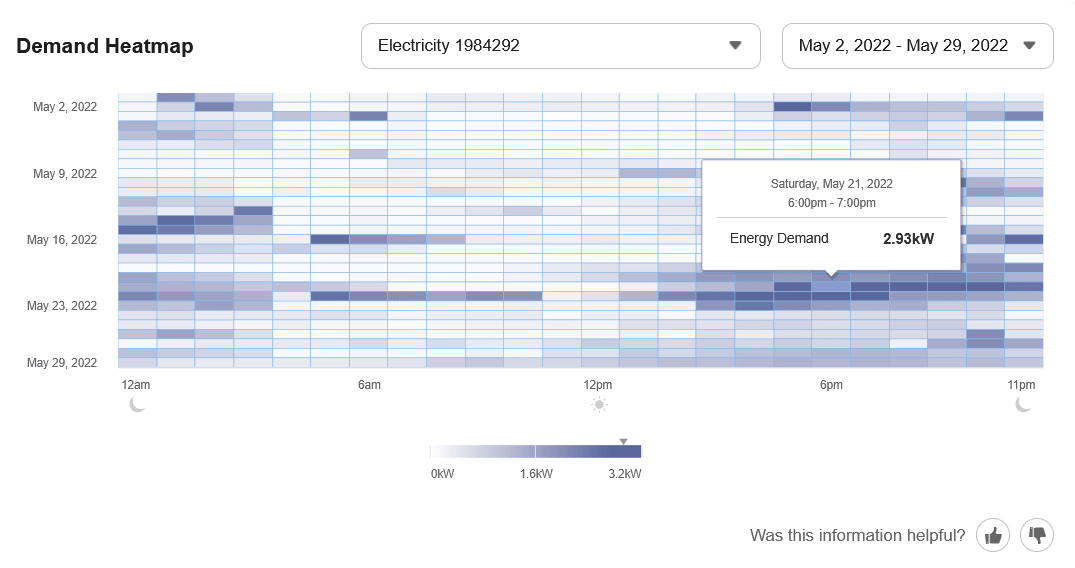
The Demand Heatmap displays a business customer's demand data in a color-coded grid, and indicates the level of energy demand during specific times, days, and weeks of the year. Use the information below to review the available configuration options.
Configuration Options
For each element listed in the table, indicate the desired configuration in the Input Value column. If you do not provide an input for optional configurations, the default will be used.
| Configuration Option | Input Value |
|---|---|
|
Heatmap Color Gradient The color gradient of the heatmap can be changed. There are several options available.
Default: The default is a single primary color gradient that is accessible for color-blind customers. |
Optional Choose one of the following: Use option 1: Default. Use option 2: A gradient ranging from green to red colors. Use option 3: Work with your Delivery Team to specify and configure up to nine color stops representing different ranges of demand. |
|
Display of Device (Meter) ID in Drop-Down Selector The device ID (meter number) can be displayed instead of the service point ID in the drop-down selector menu of the Data Browser. Displaying the device ID can be a clearer way for customers meters to identify the energy use patterns associated with each of their meters. Default: Disabled. |
Optional Choose one of the following:
|
User Experience Variations
The user experience of the feature may vary for customers and utilities depending upon their service types, available data, locale, and other factors. For more information, see Demand Heatmap in the Business Customer Engagement Digital Self Service - Energy Management Overview Guide.
