
Configuring Asset Zone
Asset Zone
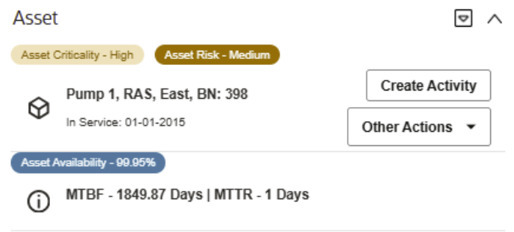
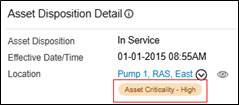
The Asset zone displays the common actions that can be taken for the asset, asset and location information, and insights for Asset Criticality, Asset Risk, and Asset Availability.
Insight Group
An insight group is required to display Asset Info and Actions, an Asset Criticality badge, an Asset Risk badge and an Asset Availability insight, including the Mean Time Between Failure (MTBF) and Mean Time To Restore (MTTR) information.
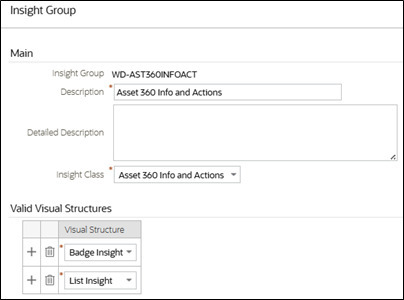
Create a new insight group for the Asset 360 Info and Actions:
- Insight Class: Asset 360 Info and Actions
-
Valid Visual Structures:
- Badge Insight
- List Insight
| Sequence | Insight Type |
|---|---|
| 10 | Asset Location Criticality Insight |
| 20 | Asset 360 Risk |
| 30 | Asset 360 Info and Actions |
| 40 | Asset 360 Availability |
| 50 | Asset 360 Availability List |
Asset Location Criticality Insight Type
This insight type has been delivered in a previous release. If you have previously set up an Asset Location Criticality badge, add the same insight type to the insight group. Otherwise, refer to Contextual Insights Configuration in the Administration Guide to set up the Asset Location Criticality Insight Type.
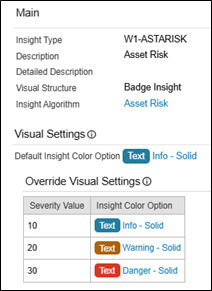
Asset Risk Insight
The Asset Risk badge is available using the Asset 360 Risk insight type. It displays either the calculated Asset Risk value or description (as defined in the bucket configuration). By default, the Asset Risk badge shows the calculated asset risk using the Default Insight Color Option
Lastly, follow the steps for Bucket Configuration and Algorithm Parameters to display the Asset Risk badge using the Override Visual Setting and Bucket Configuration description.
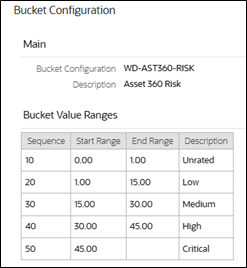
Bucket Configuration
Create a new Asset Risk bucket configuration using the Asset Bucket Configuration BO. Refer to the screenshot below for suggested Bucket Value Ranges:
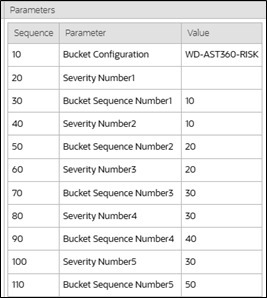
Algorithm Parameters
- Bucket Configuration: The bucket configuration you created above
- Severity Number 1-10: The Override Severity Value for it's corresponding Bucket Sequence Number. Leave blank to use the default visual setting.
- Bucket Sequence Number 1-10: Sequence numbers defined in the Bucket Value Ranges
- Severity Number: 30
- Bucket Sequence Number: 50
Asset Info and Actions Insight
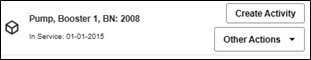
- Create Activity
- Create WO from Template
- Create Work Order
- Create Work Request
- View in Map - this action is available only for GIS sync'd assets and locations
Asset Availability Insight
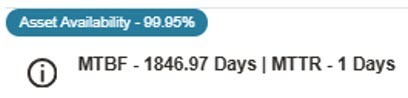
The Asset Availability insight is a pair of insight types to display both a badge and a list. It displays the percentage the asset has been operational (up and running) during the Inservice/Installed life of the asset. It also displays the Mean Time Between Failure and Mean Time To Restore information.

- If the asset availability is 75% and over, a blue badge (defined as the default insight color) is displayed.
- If the asset availability is between 51% and 74%, an orange badge (override severity value = 20) is displayed.
- If the asset availability is 50% and below, a red badge (override severity value = 30) is displayed.
Update the Asset 360 Availability (W1ASTAVLB) algorithm to override the default behavior above.
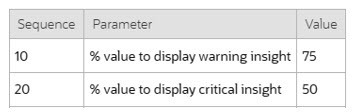
Calculations
Asset Availability, Mean Time Between Failures (MTBF), and Mean Time To Repair (MTTR) are calculated using both downtime and failure service history data. For these calculations, both the downtime and failure service histories must be associated with the same activity and activity must be in either a Completed or Closed status.
- MTBF Days = Total Uptime Days - Failures Lifetime
- Total Uptime Days = ((Difference in Seconds between IN_SERVICE_DT and CURRENT_TIMESTAMP))/60/60/24)
- Failures Lifetime = ((Total Downtime in Seconds)/60/60/24)/Failure Count
- MTTR Days = (Total Downtime in Seconds/60/60/24)/Failures Lifetime
- Asset Availability = MTBF / (MTBF + MTTR)