Efficiency Zone
The Efficiency Zone module is designed to motivate customers to save energy based on how they see themselves in relation to similar homes. It reframes the Efficient Homes concept from the Neighbor Comparison to improve customer satisfaction without heavily compromising energy efficiency. The module is comprised of a bar graph that compares customer and similar homes usage against an Efficiency Zone, and insights that place the customer's usage in context. Usage below or up to the threshold is considered in the "efficiency zone." The Efficiency Zone threshold is the average use of the most efficient 20% of similar homes during that bill period and might change with each report.
Note: Utilities have the option to replace the Efficiency Zone module with the Neighbor Comparison module.
The normative comparison in Digital Self Service - Energy Management mirrors the customer's report experience. For example, a customer that receives the Efficiency Zone in their report will also see an Efficiency Zone in Digital Self Service - Energy Management. For more information about the web version of the Efficiency Zone, see Digital Self Service Energy Management Efficiency Zone.
Appears in: Progress Report, Welcome Report, Limited Income Report, Annual Report, Time of Use Report
Requirements
Utility Requirements
|
Category |
Description |
|---|---|
|
Required Cloud Service |
Energy EfficiencyCloud Service |
|
Scale |
Not applicable. |
Customer Requirements
|
Category |
Description |
|---|---|
|
Billing Frequency |
Monthly, bi-monthly, or quarterly. |
|
Data Delivery Frequency |
Monthly, bi-monthly, or quarterly. |
|
Data Requirements |
Billed usage data. |
|
Data History |
A minimum of one historical bill. |
|
Data Coverage |
Not applicable. |
|
Supported Fuels |
Electricity, gas, and dual fuel. |
User Experience
This image shows an example of the Efficiency Zone module.
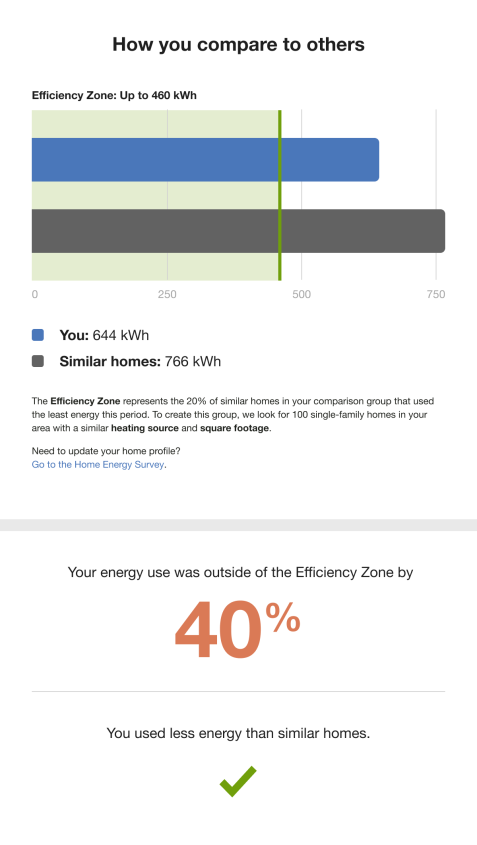
Heading: The title reads, "How you compare to others." It invites the customer to explore their normative comparison and learn about their energy use in more detail.
Threshold: The label above the graph introduces the maximum Efficiency Zone threshold (for example, Up to 500 kWh). The threshold is the average use of the 20th percentile of similar homes during that bill period. A light green tinted rectangle and darker green vertical line indicate the range and threshold of the Efficiency Zone, enabling customers to quickly see whether they are in the zone. The threshold is recalculated and changes with each report.
Graph: The bar chart displays how much energy the customer (You) used in comparison with Similar Homes. The Similar Homes bar indicates the average use of the customer's neighbors.
Hero Insight: The hero insight is the large colored numeric percentage which displays the customer's status relative to the Similar Homes. The color of the large number and percent sign varies, depending on whether they are above or below similar homes. If the customer is within the Efficiency Zone, the large number is green to visually correspond with the "Great" state of the benchmark. If the customer is not within the Efficiency Zone, the large number is orange to signal warning to the customer visually correspond with the "Fair" state of the benchmark..
The hero insight has three primary states:
- Great: In the Efficiency Zone
- Good or Fair: Outside the Efficiency Zone
- Fair: Higher than Similar Homes
Explainer Text: The explainer text explains what data goes into the comparison graph and provides the customer with a way to improve or correct these details in the Home Energy Analysis.
Secondary Insight: The secondary insight is displayed below the hero metric and varies depending on the customer's energy use. If the customer is using less than similar homes or in the efficiency zone, the secondary insight will either display a green check. If the customer is not in the efficiency zone, the secondary insight will display an orange 'x' indicating that the. There are several possible states:
- Great: In the Efficiency Zone
- Great: Near the Efficiency Zone
- Good: Lower than Similar Homes
- Good: About the same as Similar Homes
- Fair: Not in the Efficiency Zone
Customer Bill Alignment: Occasionally, the customer's previous bills do not coincide exactly in time with the previous bills of the customer’s efficient homes. In order to arrive at the similar homes averages, it is necessary to align the similar homes energy use amounts with the customer's energy use amounts. In these scenarios, the application pro-rates, or "time-shifts," the similar homes bills to align with the customer bills by determining and adjusting for the amount of overlap. The time-shifted neighbor bills are then used to determine the neighbor averages.
User Experience Variations
The user experience varies for customers depending upon their service types, available data, costs, and locale. Note that the following list indicates the primary user experience variations, not all possible variations.
Fuel Type
Gas-only and dual fuel customers see a variation in the units of energy displayed in the Efficiency Zone module. The electricity unit “kWh” is replaced by “therms” for gas-only customers and “units” for dual fuel customers. Moreover, there is a variation in the wording of the insight statement. The word "electricity" is replaced by "natural gas" for gas-only customers, and "energy" for dual fuel customers.
Explainer Text
The explainer text varies depending on the available customer data.
- Full Data: If the customer has square footage, heating source, home type, and fuel type data the text changes as follows: "To create this group, we look for 100 single-family homes in your area with a similar heating source and square footage."
- Home Size Data: If the customer has square footage, home type, and fuel type data, the text changes as follows: "To create this group, we look for 100 single-family homes in your area with a similar square footage."
- Minimum Data: If the customer has only home type and fuel type, the text changes as follows: "To create this group, we look for 100 single-family homes in your area that we can compare you with."
Substituting the Neighbor Comparison for the Efficiency Zone
Utilities have the option of including a version of the Neighbor Comparison in their report instead of the Efficiency Zone module. See the Neighbor Comparison to learn about the module limitations and requirements, and configuration options. A Neighbor Comparison will also replace the Efficiency Zone in Digital Self Service - Energy Management. See Oracle Utilities Opower Digital Self Service - Energy Management Cloud Service Product Overview for more information. Substituting the Neighbor Comparison for the Efficiency Zone module does not impact the Benchmark module.
Welcome Report and Limited Income Welcome Report (for Legacy Customers)
The upper right corner of the module includes a number that corresponds to the Efficiency Zone highlight in the Welcome module.
Annual Report
The Efficiency Zone for the Annual report includes the following variations:
- Heading: The heading is, "How your use compares to others over the last [XX] months."
- Hero Insight: The hero insight graph shows usage for the previous 12 months (or portion thereof) instead of the usual one or two month summary.