Using the Viewer
The Viewer presents a graphical representation of the distribution system, with additional symbology for conditions such as outages, crew locations, notes, tags, and so on. The Viewer dynamically updates with condition and distribution changes.
This section includes the following topics:
Starting the Viewer
To open a Viewer, select the Viewer 1... option on the Web Workspace Tools menu. To start a second Viewer, select Viewer 2... After you have opened the Viewer, selecting the menu option will change the focus to that Viewer.
Understanding the Viewer
The following diagram shows the functional areas of the Viewer:  Viewer Functional Areas Legend:
Viewer Functional Areas Legend:Understanding the Viewer Drawing Area
The Viewer's drawing area displays dynamic maps that reflect the status of the system. The lines (used to represent pipes ) and the icons (used to represent assets and conditions) are called symbols; the conventions that govern symbols are referred to as symbology.
Certain condition symbols, such as event type or note indicator, provide tooltips indicating the symbol's meaning. For example, as shown in the illustration above, the Note symbol's hover text is Operator Note.
If configured, the Viewer will dim the parts of the model that are outside of the user's authority. In those sections, the user will not be able to operate or otherwise modify those assets without taking authority using the Authority tool (see Taking Authority for Control Zones).
Understanding the Viewer Message Area
The Viewer's message area displays asset aliases, pressure zone names, and lift station names.
Using the Viewer Menus and Toolbar
The Viewer's menus and toolbars provide access to common functions.
File Menu
Option | Description | Toolbar Button |
|---|---|---|
Print | Opens the Print Preview window, which allows you to print the contents of the Viewer window. | |
Exit | Exits the Viewer. | -- |
Actions Menu
Option | Description | Toolbar Button |
|---|---|---|
Focus | Focuses the Viewer on selected assets or assets associated with selected events. See Viewer Focus for details. | |
Back | Moves to the previous view before a pan, zoom, or object focus operation (if any) changed the focus location in the Viewer. This button functions similarly to a web browser back button, storing a dozen "views." However, the loaded maps, the hide/display layers, and other options will use the current settings. | |
Forward | Moves to the next view if the Back button has been used. It functions similarly to a web browser's forward button. However, the loaded maps, the hide/display layers, and other options will use the current settings. | |
Search | Opens the Search dialog box, which allows you to enter search criteria and execute a search in the Viewer. | |
Load Maps | Allows you to explicitly load additional maps to display more of the surrounding area or additional detail. | |
Unload Maps | Unloads all maps, not just those in the visible drawing area. | |
Save View Area... | Saves the viewing area after prompting for a name for the saved area. If a view area already exists with that name, you will be asked if you want to replace it. | |
Delete View Area... | Deletes the viewing area after prompting for confirmation. | -- |
Show Lens | Opens a Lens window zoomed in on selected asset. See Using Lens Windows. | -- |
View Browser Map | Opens a web browser map to display the geographic area. | |
Hide/Display... | Opens the Hide / Display dialog box, which allows you to select what information will be displayed on the map. See Hiding and Displaying Viewer Objects. | |
Toggle Landbase | Turns the background landbase map on or off. | -- |
Toggle SCADA View | Removes all non‑essential assets to only show the pressure zone and SCADA assets. The device classes that are shown in this view can be configured on a project basis and tuned as needed. | |
Pointer Coordinates... | Opens a dialog box that displays the geographic coordinates for a selected object. | -- |
Group Events... | Opens the Group Events dialog box, which allows you to manually merge, relate, and un-relate events. | -- |
Navigate Menu
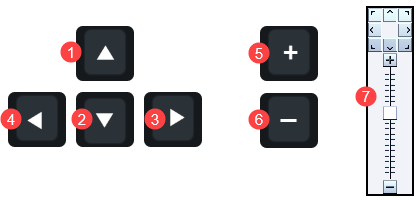
The Navigate menu lists the Viewer's navigation keyboard shortcuts and allows you to select whether the Viewer's Pan and Zoom Control is displayed in the Viewer Drawing Area. Navigation keyboard shortcuts use the keyboard arrow keys and the numeric keypad plus (+) and minus (-) keys (not the keyboard's number row).
# | Option | Description | Keyboard Shortcut |
|---|---|---|---|
1 | North | Moves the map to the north. | Up |
2 | South | Moves the map to the south. | Down |
3 | East | Moves the map to the east. | Right |
4 | West | Moves the map to the west. | Left |
5 | Zoom In | Zooms in on the map to show a smaller area in more detail. | Plus |
6 | Zoom Out | Zooms out on the map to show a larger area. | Minus |
7 | Show Pan and Zoom Control | Check box allows you to select to display the Viewer Pan and Zoom control; deselect to hide the control. | -- |
Settings Menu
Option | Description | Toolbar Button |
|---|---|---|
Fixed Size | This mode will keep the symbol and text sizes the same regardless of the zoom level. | -- |
Text Bigger | Increases the text font size. | |
Text Smaller | Decreases the text font size. | |
Symbols Bigger | Increases the size of symbols. | |
Symbols Smaller | Decreases the size of symbols. | |
Attributes Farther | Displays attributes (for example, flags, note symbols, and so on) away from the asset. Each subsequent action moves the attribute farther away. | -- |
Attributes Closer | Displays attributes closer to the asset. | -- |
Reset Scale | Resets the size of symbols and text to its default size. | |
Unload Maps on Map Load | Selection that sets the Viewer to unload previously loaded maps before loading another map. | -- |
Tools Menu
Option | Description | Toolbar Button |
|---|---|---|
Commissioning Tool | Opens the Commissioning Tool. See Using the Commissioning Tool. |
Options Menu
Option | Description | Toolbar Button |
|---|---|---|
Use CNV | Toggles between the legacy Viewer and the Common Network Viewer, which is also available in the Operations Mobile Application and in Flex Operations. | |
Big Symbols | Allows you to toggle the display of Big Symbols, which are enlarged versions of normal symbology that allow you to see certain asset types and conditions when zoomed out. | -- |
Real Time | If you are currently in Study mode, select this to switch to real-time mode. If you are currently in real-time mode, this is grayed out. For more information on real-time mode, see Real-Time and Study Mode. | |
Study | If you are currently in real-time mode, select this to switch to Study mode. If you are currently in Study mode, this is grayed out. For more information on study mode, see Real-Time and Study Mode. | |
Study Mode | Reset to Real-Time: reset the study session to the current real-time model. | |
Reset to Nominal: reset the study session to the nominal model. | ||
Reset...: displays the Reset Study Session dialog, which allows you to reset your session. | ||
Save Case Management...: opens the Save Case Management tool, which allows you to view, modify, delete, or reset to session changes. See Using the Save Case Management Tool for more information. | ||
Close Study Session: closes the study session and returns the Viewer to real-time mode. |
Help Menu
Option | Description | Toolbar Button |
|---|---|---|
Viewer Help | Opens online help content for the Viewer. | -- |
Color Legend | Opens the Color Legend window, which displays information about symbology coloring. See Understanding Viewer Coloring for more information. | -- |
Highlight Legend | Opens the Highlight Legend window, which displays information about the current view. See Understanding Viewer Coloring for more information. |
Additional Viewer Toolbar Options
The following toolbar options do not have corresponding menu options:
Option | Description |
|---|---|
The Control Tool button opens the Control Tool for the selected asset. The Control Tool may also be opened by double-clicking an asset or by right clicking the asset and selecting Control Tool... from the context menu. (See Using the Control Tool.) | |
The Trace button opens the Trace tool window, set to the current asset. The Trace tool may also be started by right clicking the asset and selecting Trace... from the context menu. (See Executing Traces.) | |
The Asset Details button toggles asset details on or off. Asset Details may also be toggled on or off by right clicking the asset and selecting Asset Details... from the context menu. (See Displaying Asset Details.) |
Saving Viewer Preferences
When you have adjusted the Viewer options to render symbols, text, and window information as desired, you may select Save Preferences from the Web Workspace User menu's Manage Preferences submenu to save the options for subsequent sessions.
Understanding Viewer Tooltips
When you hover over a crew, an event, a device, or a condition, a tooltip will appear. This tooltip displays characteristics of the crew, event, device, or condition, such as the crew name, type, event number, etc. Move your mouse over the tooltip to keep it visible. Otherwise, it will disappear after a few seconds.
Understanding Viewer Context Menu Options
When you select certain objects in the Viewer and right-click, a context menu will display a list of options available for the object.
Crew Context Menu Options
The following options are displayed when you right-click a crew symbol in the Viewer window; these options are only available for crews with AVL (Automatic Vehicle Location) systems.
Menu Option | Description |
|---|---|
Assign | Assigns the crew selected in the Viewer to the event currently selected in Work Agenda. See Assigning a Crew to an Event for more information. |
En Route | Puts the crew selected in the Viewer en route to the event currently selected in Work Agenda. This is enabled only if the selected crew is an on-shift, available, non-mobile crew that is not currently en route or onsite. See Placing a Crew En Route for more information. |
Release Crew | Releases the crew selected in the Viewer from the en route/onsite event selected in the Work Agenda. See Releasing Crews from an Event for more information. |
Update Availability... | Opens the Update Crew Availability dialog box for the selected crew. See Changing Crew Availability for more information. |
Crew Info... | Opens the Crew Info dialog box for the selected crew. See Using Crew Info for more information. |
Event Options
The following options are displayed when you select an event symbol and right-click to open the context menu:
Menu Option | Description |
|---|---|
Event Details... | Opens the Event Details window for the event. See Understanding Event Details. |
Trouble Info... | Opens the Event Details Trouble Info tab for the event. See Using the Trouble Info Tab. |
Event Log... | Opens the Event Details Event Log tab for the event. See Using the Event Log Tab. |
Damage Assessments... | Opens the Event Details Damage Assessments tab. See Using the Damage Assessments Tab. |
Crew Info... | Opens the Crew Info window for the crew assigned to the selected event. See Using Crew Info. |
Show En Route Location... | Shows the AVL location of the crew that is currently en route to the selected event. This option is only enabled when one crew is assigned to the event. |
Release Crews... | Opens the Release Crews dialog box. Enabled when one or more crew is assigned to the event. See Releasing a Crew from the Crew Symbol in the Viewer. |
Make Predicted Stable | Makes currently selected predicted outage stable. Visible only when currently selected predicted outage can be made stable. See the Working with Stable Predictions for more details. |
Remove Predicted Stable | Removes stable flag from the currently selected predicted stable outage. Visible only when a predicted stable outage is selected. See the Working with Stable Predictions for more details. |
Condition Options
Condition sizing and locations can be adjusted by an administrator; non-administrators can move conditions temporarily during their session. For conditions, moving a condition affects any conditions at an asset position, including future conditions for that device. Measures and conditions may be moved.
Menu Option | Description |
|---|---|
Move | Moves a condition to a new location. If there are multiple conditions at a location, only the condition closest to the device can be moved. |
Show Leader Line | Shows the leader line for the asset. |
Hide Leader Line | Hides the leader line. |
Reset Location | Resets the condition position to the default location. |
Rotate Clockwise | Rotates the symbol clockwise (only available for measurements). |
Rotate Counterclockwise | Rotates the symbol counterclockwise (only available for measurements). |
Resize Bigger | Increases the symbol size (only available for measurements). |
Resize Smaller | Reduces the symbol size (only available for measurements). |
Asset Options
Depending on the asset type, the following options may be displayed when you select an asset and right-click to open the context menu:
Menu Option | Description |
|---|---|
Control Tool... | Opens the Control Tool for the selected asset. See Using the Control Tool. |
Asset Details... | Displays the Asset Details balloon above the selected asset. See Displaying Asset Details. |
Attributes... | Opens the Attributes window, which displays information about the selected asset. See Viewing Asset Attribute Information from the Viewer. |
Open... | Initiates the Control Tool's Open command. See Control Tool Actions. |
Close... | Initiates the Control Tool's Open command, if applicable. See Control Tool Actions. |
Customer List... | Displays the Event Details Trouble Info tab's Customers List view. See Using the Trouble Info Customers View for more information. |
Damage Assessments... | Opens the Event Details Damage Assessments tab, which displays a list of damage assessments associated with the asset and allows you to add new damage assessments. See Using the Damage Assessments Tab. |
Quarantine | Add a quarantine assessment condition. See Assessment.... |
Start Patrolling | Add a Start Patrolling assessment condition. See Assessment.... |
Remove Assessment | Remove the assessment condition. See |
Generate Tag Steps | Allows you to generate a set of steps in the active switch sheet to tag devices upstream from the selected asset. These will appear in a new Place Tags steps block. |
Toggle Call Display | Toggles call display on or off. When enabled, a symbol is displayed in the Viewer window for any assets that have calls associated with an event. Events with calls and clues will show the call symbol and clue symbol. |
Trace... | Opens the Trace tool, which allows you to display the path from a selected asset to other assets based on specific criteria. See Executing Traces. |
Using the Legacy Viewer and the Common Network Viewer
There are two types of Viewers available in the Web Workspace. The first is the legacy Viewer that provides full functionality of the system; the second Viewer is a newer Common Network Viewer (CNV), which is also used by Flex Operations and Operations Mobile application.
Note: Future versions of the Web Workspace will only support the CNV.
To switch between the Viewers, select Use CNV from the Viewer's Options menu. You can toggle between the two on different Viewers independently.
The CNV currently supports most of the Legacy Viewer's functionality, but there are a few limitations. The following functional items are not currently available on the CNV:
• Lenses
• Device details balloons
• Moving conditions. (Though if conditions are moved, they will display correctly in CNV.)
• Tooltips (the Flex tooltip displays are currently more limited).
• Toggle Call display (from the Control Tool).
• Outage summary display.
• Dragging a crew to a different location.
• Viewing multiple single line schematics at the same time.
Displaying Asset Details
Asset Details provides information about assets selected in the Viewer. Asset Details is enabled by clicking the Asset Details button ( ) in the Viewer's toolbar or by right-clicking an asset and selecting Asset Details... from the context menu.
) in the Viewer's toolbar or by right-clicking an asset and selecting Asset Details... from the context menu.When Asset Details is enabled, selecting an asset will automatically launch a balloon-style callout window attached to the asset in the Viewer. Selecting a different asset will close the first window and open a window for the newly selected asset. To keep a window open, you may pin it by clicking the pin button ( ). You may unpin the window by clicking the unpin button (
 ) or close it by clicking the close button (). Asset Details windows may be dragged to a different location in the Viewer or resized.
). You may unpin the window by clicking the unpin button () or close it by clicking the close button (). Asset Details windows may be dragged to a different location in the Viewer or resized.The Asset Details tabbed data views provide relevant information based on the object selected. Data is refreshed whenever you select a different tab, but you may manually refresh the data by clicking the refresh button (). Click the Help button () to display help for the active tab.
The Asset Details tabs provide the following information:
Asset Info: The information contained in the Asset Info tab varies depending on the type of asset and its current condition, but may include the following types of information:
• Event information, such as number of customers affected, when the event began, estimated restoration time, event type, event number
• Event Note
• Location
• Asset Notes
• Crew information
• SCADA: The SCADA tab displays SCADA asset data. It is only enabled for SCADA assets in systems that have implemented SCADA Extensions; see Resize Smaller: Decreases the size of the measurements. (Administration users only.)Displaying SCADA Measurements with Asset Details for details.
•
•
•
Note: The Position will state either "on" or "off" depending on the state of the capacitor. When "off," the device will show as being open in the NMS model.
•
•
•
•
•
•
Viewing Asset Attribute Information from the Viewer
You can access attribute information related to an asset using the Viewer. Asset attributes include physical and reference information about an asset, such as location and rating.
To view asset attributes from the Viewer, complete these steps:
1. Right-click an asset in the Viewer.
2. From the context menu, click Attributes…. The Attributes window opens as a dockable pane in the Viewer.
About the Attributes Window
The Attributes window is tabular and allows standard sorting and filtering.
The information in the Asset Information is view-only. Once the asset attribute window is open, selecting another asset in the Viewer will update the information for the selected asset.
Understanding Viewer Coloring
When the Viewer is launched, the network model is displayed with Pressure Zone coloring where all pipes fed from a source are displayed in the same color. Conditions affecting the network are displayed with highlight coloring, which overlays a glow on the affected network component.
Viewing the Color Legend
To see the color legend for the view, select Color Legend... from the Viewer Help menu.
Viewing the Highlight Legend
To see the highlight legend for the view, select Color Legend... from the Viewer Help menu.
Note: Impacted highlighting will only appear when customers are affected.
Searching and Loading Viewer Maps
The Viewer Search functionality allows you to quickly focus the Viewer on an area or object.
• Search Type Option • Search Case Option • Search Result Limit • Customer Information Section • Account # • Name • Address • Telephone • Meter Number • Intersection • Street 1 • Street 2 • Pressure Zone Name • Asset ID • View Area • Crew ID • Event # |  |
Using the Search Tool to Locate Map Areas and Objects
To locate a particular area or object in the Viewer, complete these steps:
1. Click the Search button on the Viewer toolbar or from the Actions menu. The Search dialog box opens.
2. Select the Search Type you wish to perform (Exact Match, Wildcard Before, Wildcard After, Wildcard Before and After, Soundex) from the Search Type option menu.
3. Select the Search Case option you wish to use (Case Insensitive, Case Sensitive) from the Search Case option menu.
4. Enter your search result limit in the Search Result Limit field (default value is 100).
5. Click the desired search field and either enter search criteria or leave the field blank to return all possible values (up to the search result limit).
6. Press ENTER or click the Search button.
7. If there is only one match, the Viewer will shift focus to the search result. If there are multiple matches, a Search Results dialog box displays the search results and the Search dialog box closes.
For example, an Intersection search using the term Oaklynn returns six matches.

8. If there are multiple matches, select a row in the Search Results dialog box and click the OK button. The object appears centered in the Viewer and the Search Results dialog box closes.
Note: If none of the results are what you wanted, click Cancel in the Search Results dialog box. The Search Results dialog box closes and the Search dialog box is redisplayed.
Loading and Unloading Viewer Maps
Once you have located an area or object using the Search dialog box, you can navigate to an adjacent area where the maps are not yet loaded. From here, you can load all the maps that should appear in the drawing area.
To load maps, do one of the following:
• Select Load Maps from the Actions menu.
• Press the M key.
• Click the Load Maps button () on the toolbar.
To unload all maps (not just those in the visible drawing area), do one of the following:
• Select Unload Maps from the Actions menu.
• Press Shift+U.
• Click the Unload Maps button ()on the toolbar.
Note: Unless your system is configured to unload maps with each focus, any loaded maps will continue to be loaded until you explicitly unload maps or you switch mode (that is, from study to real-time or from real-time to study).
If there are more assets displayed than the configured maximum, which is 500,000 in the product configuration, the viewer will unload the maps that have the oldest access time to get the total under the limit.
Navigating in the Viewer
There are a number of ways to navigate (pan and zoom) in the Viewer drawing area:
• Use keyboard shortcuts. See Navigate Menu for the available keyboard shortcuts.
• Use the Pan and Zoom Control. You can show or hide the control by selecting or deselecting, respectively, the Navigate menu's Show Pan and Zoom Control check box.
• Pan left, right, up, down, or diagonally in the map using the pan compass.
• Use the Plus (+) and Minus (-) buttons on the zoom slider to zoom in and out. You can also drag the zoom slider toward the + to zoom in or toward the - to zoom out. The scale indicator displays the current zoom scale. The scale is hidden if a schematic view, such as a substation, is selected.
• Navigate using your mouse controls, as described in the next section.
Navigating Using Mouse Controls
There are various mouse controls you can use to navigate within the Viewer. The following table shows the Viewer's mouse commands.
To… | Do this… |
|---|---|
Select an object | Click the object. |
Select multiple objects | Shift-click and drag to extend the selection rectangle around the area with the object you want to select. The Select an Asset dialog box will open listing all of the assets in the selection area. |
Box Zoom | Box Zoom allows you to focus on an area. Click and hold the middle mouse button to begin drawing the rectangle and release it to complete drawing the rectangle; the Viewer will display the area selected at a zoom level that allows the area to fill the Viewer drawing area. |
Zoom out | Scroll upward with the scroll wheel, if available. |
Zoom in | Scroll downward with the scroll wheel, if available. |
Open the Control Tool | Double-click the object. |
Move the map | Click and drag the map to a new location. |
Flick map | If you drag in the Viewer drawing area while pressing the left mouse button and then release the mouse button (while in the dragging motion), the Viewer map will continue to move in the direction you were dragging (for a bit). |
Scaling Symbols and Text
To make the symbols for major assets and conditions prominent while zoomed out, select Symbols Bigger () from the Viewer's Actions menu. The symbols remain large even as you zoom out, but will still disappear at standard Declutter levels. Conversely, you may make the symbols smaller by selecting Symbols Smaller ().
To make text annotations, such as asset ID, phase indicator, and so on, larger, select Text Bigger () from the Viewer's Actions menu. To make text smaller, select Smaller Text ().
To reset symbols and text to their standard sizes, select Reset Size () from the Viewer's Actions menu.
Displaying Pointer Coordinates
To view the coordinates of a point in the Viewer, click and select Pointer Coordinates... from the Viewer's Actions menu. The Pointer Coordinates dialog box will open with the following information:
• Window X/Y: the position in the current drawing area view.
• Coordinates (X/Y) (Geographic Coordinate System)
• Latitude/Longitude
• Distance from Previous Coordinate (Feet)
Note: The keyboard accelerator (C) is very useful for quickly opening the Pointer Coordinates window.
Viewer Focus
The Viewer's Focus option is context aware and will function according to your selection.
• If you select an object in the Viewer, clicking the Viewer Focus button will focus on that object.
• If you select an event in the Work Agenda and click the Viewer Focus button, the Viewer will focus on the asset/object associated with the event.
Focus on Viewer Selection
If you select an object in a geographic view in the Viewer and click the Focus button, the Viewer will center the object and zoom in/out as necessary. If the object is part of a schematic view, the first Focus action will display the object in the diagram view. Each successive click will cycle the Viewer through alternate views, if available, until it cycles back to the geographic view.
Note: Viewing schematics may not reflect the current (real-time) state of the network since the schematic views are generated by the model build process.
Focus on Selection Made in another Window
When you make a selection of an event in another window (for example, the Work Agenda) and click the Viewer Focus button, the Viewer will find the asset and focus the drawing area on it.
9.
Using Lens Windows
The Viewer's Lens functionality allows you to start a "mini-Viewer" window that is focused and zoomed in on a selected asset. To start a Lens window, select an asset in the Viewer and select Show Lens from the Viewer's Actions menu. The Lens window will open zoomed in on the asset
Behaviors of the Lens Window and Viewer Lens Area
The area displayed in the Lens window is indicated by a red rectangle in the Viewer's Drawing Area. The red rectangle may be moved directly in the Viewer by clicking and dragging. As the rectangle moves, the Lens window will update to show the area inside the rectangle. Likewise, panning and zooming in the Lens window will be reflected by position and size of the rectangle in the Viewer.
When the Lens is started, its text size, symbol size, attribute size, coloring rule, and big symbols are all synchronized with the Viewer; thereafter, the Lens settings are independent. If you want to resynchronize the Lens settings with the Viewer settings, close and reopen the Lens. Note that real-time/study mode and tracing are always synchronized between the Viewer and the Lens.
Real-Time and Study Mode
NMS applications start in real-time mode, where every action you perform is applied to the real-time model and displayed to all users. Certain windows (the Viewer and the Control Tool) allow you to change to study mode, where your actions are reflected in your study session on your workstation, but not recorded in the real-time model. Study mode is especially useful in "what if" studies, when you need to evaluate the effects of an action before you record it in real-time.
When in real-time mode, the Viewer displays status, topology, and condition information based on real-time operations information. All changes to these items made by any user in real-time mode are reflected on all real-time Viewers in the system.
When in study mode, the Viewer displays only status and topology changes you make on your workstation. Changes made in your study session are not reflected in the real-time model, and likewise changes made in real-time are not reflected in your study session. When in study mode, the Viewer displays information about the study session in the upper left corner of the drawing area and there is a green glow inside the window frame.

A study session is created for a specific workstation the first time you put the Viewer into study mode. The study session is initially created as a copy of the current real-time model. From that point on, changes in the study session and real-time are independent of each other. You can reset the study session to current real-time by using the Study Session Control tool. In addition, some Web Switching Management actions can also cause study session resets. Please refer to the Web Switching Management chapter for more information.
Note: It is recommended that you reset study sessions to real-time as often as makes sense (for example, when starting a new switching plan, testing a new ‘what if' scenario, and so on). This is especially important during high load periods (for example, a storm).
Switching to Study Mode
To toggle the Viewer to study mode, do one of the following:
• Select Study from the Options menu, or
• Click the study mode button () on the toolbar.
The Viewer window borders change color to gray.
• You can reset the study session to either the current real-time model or the nominal model using the Viewer's Reset Study Session… button in the Options menu.
Switching to Real-Time Mode
To toggle the Viewer back to real-time mode, do one of the following:
• Select Real Time from the Options menu, or
• Click the real-time button () on the toolbar.
The Viewer window borders and dialog boxes change color back to red.
Selecting Assets
Asset Selection
• To select a single asset in the Viewer, click the asset symbol. If you are selecting a Viewer area that has multiple objects, it will find the object that is on top using the configured draw order.
Box Selection
Box selection is used to select an asset from an area containing multiple assets. To perform a box selection, Shift-click and drag in the Viewer drawing area to create a rectangular selection box. When you release the mouse, the Select an Assetwindow opens and is populated with all assets within the selection area. Select any asset in the list to highlight it in the Viewer; highlighting changes the asset symbology to the selection color, but the asset is not selected until a selection action is initiated.
Select an Asset provides the following actions:
• Select: Selects the highlighted asset and closes the window.
• Control Tool: Selects the highlighted asset, opens its Control Tool, and closes the window.
• Asset Details: Selects the highlighted asset, opens the Asset Details window above the asset in the Viewer, and closes the window.
• Cancel: Closes the window. The last highlighted asset, if any, will remain highlighted in the Viewer, but will not be selected for subsequent Viewer actions.
Note: Only a single asset can be selected at any given time unless the Viewer is in Supply Points mode.
Polygon Selection
Polygon selection is an advanced form of box selection. To begin a polygon selection, press the Alt key and click the Viewer drawing area to place the first anchor point; continue to press Alt and click to add additional vertices. To complete the polygon, press Alt and right-click to connect the last vertex to the first vertex. Once the selection polygon is complete, the Select an Asset window will appear listing all assets that were inside the area.
Multiple Selections
If you are in Supply Points mode, you can use Box Selection or Polygon Selection to select multiple supply points. To add a supply point to your selection press the Control key and click the supply point; likewise, to remove a supply point from your selection, press the Control key and click a selected supply point. You may also add multiple supply points to your selection by pressing the Control key while performing a box selection.
Identifying Symbology
Asset Symbology
Changes in the status of an asset (for example, valves, pumps, and so on) are reflected by changes in symbology.
Condition Symbology
Dynamic conditions on an asset (for example, "predicted service outage," "crew on-site," "notes," and so on) are indicated with specific symbols attached to the asset to which the conditions apply.
Condition symbols display in specific areas around an asset or object. The following table provides examples of where condition symbols display in relation to the asset they are attached to. The following figure displays the Viewer with probable asset outage, crew on-site, note and tag conditions.
Area | Symbols |
|---|---|
Above Left | Tags |
Above Right | Probable Service/Asset Outages Real Outages |
Below Left | En route/Onsite Crews |
Below Right | Notes Call Clues |
Work Agenda Interaction with Event Condition Symbols
When you select a condition symbol for an event, such as a predicted service outage symbol, the corresponding row in the Work Agenda will be highlighted and the Work Agenda table will scroll to display the row, if necessary. If the event is not in the Work Agenda filtered view, the Work Agenda will not change to a filter that would show the event and the selection will be cleared; for example, if the Work Agenda is set to show completed events, selecting an active event symbol will not change the Work Agenda to the "To Do" view to show the event.
Related
Pipe Symbology
Pipe symbology changes color, dash patterns, and thickness for different types of pipes and topology states.
SCADA Symbology
For systems with SCADA Extensions, the Viewer provides many visual cues about SCADA assets and their statuses. For details on SCADA symbology, see Hide Measurement in Viewer: Hides a measurement in the Viewer.Understanding SCADA Information in the Viewer .
Hiding and Displaying Viewer Objects
The Viewer's Hide/Display tool allows you to display only those map elements (for example, layers, objects, crew types) that are of interest to you. To change visibility of components displayed in the Viewer, complete these steps:
1. Click the Hide/Display () toolbar button. (Alternatively, you may select Hide/Display... from the Actions menu.)
2. Select the elements that you want displayed; deselect those elements that you do not want displayed.
Note: Hide/Display is a configurable feature of NMS so your dialog box may have different options.
3. Hide/Display options may include:
• Layer Groups: defined groups of single layers listed in the Layers pane.
• Layers
• Highlighting
• Predicted Impacted: Adds a glow around an object that is predicted to be off supply
• Confirmed Impacted: Adds a glow around an object that is confirmed to be off supply.
•
Note: If more than one highlighting color matches, the following order of importance is used:
• Predicted Impacted
• All other highlighting (following the configured pipe coloring priority).
To see the color legend for highlighting glows, select Highlight Legend... from Viewer's Help menu.
• Crew Types
• Incidents: Allows you to choose whether to display all calls or just AMI notifications and whether to display symbols for all damaged assets or only the main asset for each damage report.
• Show All Calls
• Show All AMI
•
• Show All Damage
• Spatial Landbase Menu: Allows you to chose which Spatial Landbase to use. The options available will depend on your installation.
• The Network Level menu allows you to choose to display:
• The Pending Assets menu allows you to choose to display construction pending, decommissioning conditions, and inactive assets. Options are:
• Hide Pending Assets (the default)
• Show Pending Assets
4. Click the Close button to close the Hide/Display dialog box.
Decluttering the Viewer
The Viewer automatically hides objects based on predefined declutter zoom levels. This allows you to only see high-level information at higher zoom levels, removing small text and other items that are no longer readable at that zoom level. When an object is decluttered, any associated conditions and text will also be decluttered. The declutter option in enabled by default, but you can turn it off by unchecking the Declutter (On/Off) option in the Hide/Display dialog box.
Hiding Conditions with Assets
The Hide Conditions with Assets option, which is selected by default, will hide all conditions when their associated assets are hidden, either due to other Hide/Display options or decluttering. When not checked, the conditions will always display, even when their assets do not.
Adjusting Condition Display
Device Conditions and measurements can be moved to tidy the Viewer display. Operations users can temporarily move a condition for the current session; Administrators can adjust condition display system wide. If you have permission to move conditions, the Move option will be available through the right‑click context menu when selecting the condition symbol.
Note: If multiple conditions are shown at a position, only the condition closest to the device can be adjusted.
Move: Allows moving a condition for the device to a new location. This changes the placement for conditions that appear at a certain location.
For example, if the condition is in the lower left position, any conditions that are in the lower left will display at the new location.
• Show Leader line: Turns the leader line on.
• Show Leader line: Turns the leader line off.
• Show Leader line: Restores the condition to the default location
If a measurement is right‑clicked, the following additional options are available:
• Rotate Clockwise
• Rotate Counterclockwise
• Resize Bigger
• Resize Smaller
Executing Traces
The trace feature allows you to display the path from a selected asset to other assets based on specific criteria. The trace path is displayed on the Viewer by changing all pipes that are part of the path to a thick light blue.
This section includes the following topics:
For a description of the fields and buttons on the Trace dialog box, see Using the Trace Dialog Box.
Trace Types
The following table describes the various types of traces.
Trace Type | Description |
|---|---|
To Source | Traces from the selected asset to its source. |
All Connected | Traces from the selected asset to all connected assets, stopping only at sources. |
To Valve | Traces from the selected asset to upstream and downstream valves. |
To Asset Class | Traces from the selected asset to an asset class. Click the Search button () to open the Select Class dialog box, which displays a tree list of device classes. Multiple device classes can be chosen by holding down the CTRL key when selecting additional classes. After making your selection, click the OK button to close the dialog box. |
To Closed Points | Traces from the selected asset to all directly-connected closed points on the pressure zone. |
To Nominally Closed Points | Traces from the selected asset to all directly connected nominally closed points on the pressure zone. |
Using the Trace Dialog Box
Understanding the Trace Dialog Box Toolbar
Toolbar Icon | Description |
|---|---|
The Trace button executes the trace. | |
The Clear button erases the trace color from the Viewer and returns to normal color. | |
The Refresh button performs the trace again. This is useful if assets have been operated or the model was rebuilt. | |
The Trace Focus button focuses the Viewer on the entire extent of the trace. | |
The Endpoint button focuses the Viewer on the endpoint asset of the trace. This option is disabled if the trace is in all directions (since there will not be a single endpoint). | |
The Help button displays online help for the Trace function. |
Understanding the Trace Details Pane
To display the Trace dialog box, click the Trace button on the Viewer toolbar and select an object. The Trace dialog box displays the following fields and buttons:
• The first drop-down list allows you to select the trace type, as described in the Trace Type table above.
• The second drop-down list allows you to select the trace direction:
• Upstream: Constrains the trace to be only upstream of the selected asset.
• Downstream: Constrains the trace to be only downstream of the selected asset.
• All: Allows the trace to be both downstream and upstream of the selected asset.
Note: Tracing all connected assets will automatically trace both upstream and downstream. Tracing to source will automatically trace upstream.
• The third drop-down list allows you to select the trace mode:
• Current Session: Performs the trace by using statuses currently displayed in the Viewer. This is the default.
• Nominal: Performs the trace by assuming nominal statuses for all assets.
• The fourth drop‑down list allows you to select what devices to display in the Trace Results dialog box table:
• No Table: The Trace Results dialog box is not displayed.
• Protective Devices: The Trace Result dialog box shows devices and fuses along the trace.
• Switches: The Trace Result dialog box shows all switches along the trace.
• Device Class: Allows you to open the Select Class dialog box to choose one or more classes to show in the Trace Results dialog box; see Using the Select Class Dialog Box for details.
• All Devices: All devices along the trace will be shown in the Trace Results dialog box.
Advanced Trace Dialog Box Fields
Click the Advanced (Expand) button in the bottom-right corner of the Trace dialog box to display additional information about the selected object, including detailed topology. You can also inspect direct connections and navigate to connected objects.
When you click the Advanced button, the Trace dialog box expands to display the following information.
The Asset Details section displays the following asset information:
• Asset type
• Asset handle
• Network Component Group (NCG)
• Map containing the asset
• Display group
The Symbol Details section displays the following symbol information:
• Symbology class
• Symbol ID
• Coloring status
• Valid statuses
• Coloring rule
• Symbol coordinates
The Connectivity Details section displays the following connection information:
• Pressure Zones
• Current statuses
• Nominal statuses
• Other statuses
The Connections section displays a list of connected nodes for the selected object. You can expand the list of connections for each node and focus the Viewer on an object in the list. For more information, see Inspecting Direct Connections and Navigating to Connected Objects.
Executing a Trace
To execute a trace, complete these steps:
1. Select the asset you want to trace from and click the Trace button (). (See Using the Trace Dialog Box for field descriptions.)
2. Select the trace type, direction, and mode as described in the following table:
To trace... | Do this… |
|---|---|
To all connected assets | Select All Connected from the drop-down list and then click the Trace button. The Viewer traces from the asset to all connected assets stopping only at a source. |
To connected valves | Select To Valve from the first drop-down list and select the direction from the second drop-down list. Click the Trace button. The Viewer traces from the asset to all valves in the specified direction. |
To the source | Select To Source from the first drop-down list. Click the Trace button. The Viewer traces from the asset upstream to the source. |
To a specific asset class | Select "To Asset Class" from the first drop-down list. The Asset Class field and Search button will be displayed. Click the Search button to open the Select Class dialog box. Expand the object tree and select the asset class that you wish to trace to. Click OK to populate the Asset Class field. Click the Trace button. The Viewer traces to that asset class. |
Upstream | Select either "To Valve" from the first drop-down list, and then select "Upstream" from the second drop-down list. Click the Trace button. |
Downstream | Select either "To Valve" from the first drop-down list, and then select "Downstream" from the second drop-down list. Click the Trace button. |
Both upstream and downstream | Select either "To Valve" from the first drop-down list, and the select "All" from the second drop-down list. Click the Trace button. (Tracing all connected assets and tracing to the source will automatically trace both upstream and downstream.) |
Using statuses currently displayed in the Viewer | Select "Current Session" from the third drop-down list. Select the tracing option (All Connected, To Valve, and so on) and the direction, then click the Trace button. |
Using nominal statuses | Select "Nominal" from the third drop-down list. Select the tracing option (All Connected, To Valve, and so on) and the direction, then click the Trace button. |
Understanding the Trace Results Dialog Box
When you select to see trace results in a table (any selection other than No Table), the Trace Results dialog box will be displayed once you click the Trace button ().
Menus and Toolbar Options
File Menu
Menu Option | Description | Toolbar Icon |
|---|---|---|
Export | Exports the table to a .csv file. |
Help Menu
Menu Option | Description | Toolbar Icon |
|---|---|---|
Trace Results Help | Shows the online help. |
Understanding Data Table Actions
If you double‑click a table row, the table will focus the Viewer on the row's device.
If you right‑click a table row, you can choose from the following context menu options, if applicable:
• View...: Focus the Viewer on the asset.
• Calculate Values: This will calculate the customer counts for the row.
• Look Ahead...: Opens the Look Ahead dialog box. See Using the Look Ahead Dialog Box for more information.
Click OK to close the Trace Results dialog box.
Inspecting Direct Connections and Navigating to Connected Objects
Use the advanced fields on the Trace dialog box to inspect direct connections and navigate to connected objects.
1. In the Viewer drawing area, select the asset you want to trace from and click the Trace button.
2. Click the Advanced button () in the bottom-right corner of the Trace dialog box. The dialog box expands to display detailed connection information.
3. In the Connections box at the bottom of dialog box, click the + sign to expand a node and display all connection branches.
4. Right-click a connection row and select Focus from the context menu. The Viewer focuses on the object and colors it with the specified color. The Trace dialog box displays details for the newly selected object, including a list of its connections. Refer to Advanced Trace Dialog Box Fields for more information.
5. Repeat steps 4 and 5 needed to inspect more connections.
Using the Commissioning Tool
The Commissioning Tool allows you to commission an asset that is currently in construction or decommission assets currently marked for removal.
To open the Commissioning Tool, select Commissioning Tool... from the Viewer's Actions menu. The Commissioning Tool displays two panes:
• The Waiting for Approval pane displays a table of assets that need to be approved and indicates their current statuses (To Commission or To Decommission).
• The Approved pane displays a table of assets approved for removal and indicates their current statuses (Commissioned or Decommissioned).
If no pending assetsare currently selected, both panes will be empty.
The tables may be sorted by either the Asset or Status column and may be filtered using the filter fields at the top of the table columns. The status bar at the bottom of the Commissioning Tool window indicates the current real-time or study mode status.
You can perform the following actions on the assets displayed in the Commissioning Tool window:
Task | Description |
|---|---|
Approve the selected assets. | Select one or more assets in the Waiting for Approval list and click the approve button (); alternatively, you may use the right-click menu option. The assets are moved to the Approved list and their symbols in the Viewer change from red or green to gray. |
Focus on the asset in the master Viewer window. | Select a single asset in either list and click the Focus button (); alternatively, you may use the right-click menu option. |
Remove selected assets from the list. | Select one or more assets in either list and click the Remove button (); alternatively, you may use the right-click menu option. |
Undo the approval for the selected asset. | Select one or more assets in the Approved list and click the Undo button (); alternatively, you may use the right-click menu option. The assets are moved to the Waiting For Approval list and their symbols in the Viewer change from gray back to red or green. |
Commissioning and Decommissioning Assets
To commission or decommission sets of assets, perform the following steps:
1. In the Viewer, load the pending asset changes you wish to modify. You can select multiple assets.
2. Enable the Show Pending Assets option in the Hide/Display dialog box.
3. Switch to study mode if you don't want to affect the real-time model.
4. Select Commissioning Tool... from the Viewer's Actions menu. Selected assets pending approval are listed in the Waiting for Approval pane.
5. Select the assets you want to commission or decommission, then click the Approve () button.
Notes:
• Assets being decommissioned are no longer part of the model and are immediately colored as disconnected.
• Commissioned assets immediately become part of the model and connections are recalculated (that is, a newly commissioned asset attached to a supply will color as supplied).
Selecting Pending Assets
When you select an asset in the Viewer that is pending construction or decommission, the asset is listed in one of the panes in the Commissioning Tool. To select multiple objects, shift-click and drag until the selection box surrounds the objects.
Note: Use the Show Pending Assets option in the Hide/Display dialog box to display or hide pending assets.
The Viewer displays the following commissioning-related conditions:
Symbol | Description |
|---|---|
 | Unapproved pending construction. |
 | Approved pending construction. |
 | Unapproved pending decommission. |
 | Approved pending decommission. |
Using the Commissioning Tool with Web Switching Management
The Commissioning Tool will generate switching steps for each commissioning/decommissioning assets action when Web Switching Management is licensed. Commissioning/decommissioning actions will always be recorded in Real-Time mode. The actions will either go into the Miscellaneous Log, Event Details Steps tab, or a switching sheet recording Real-Time operations. The tool recording the commissioning change will be indicated at the top of the Commissioning Tool.
Non-complete Commissioning and Decommissioning steps can be executed over and over again in Study mode within the switching sheet they were recorded into. In Real Time, the steps can only be Instructed and Completed one time which will initiate the action against the Real Time model. Completing the step in study mode will only cause the action to be completed in the user's study session.
For performance purposes, Commissioning and Decommissioning steps should be completed in groups by highlighting multiple steps during step execution operations. This will force the requests to be packaged and processed as a batch request. The batch processing will only work if the Commissioning and Decommissioning steps are contiguous in the steps list without any other type of step mixed in. You can still highlight a larger group of steps containing a mixture of step actions and execute them, but each contiguous group of Commissioning and Decommissioning steps will be processed as a batch request.
An error will be generated when completing a commissioning/decommissioning step where the asset has not been setup for commissioning or decommissioning. This error will cause the step to not complete and will halt step execution.
A warning scenario will be generated when completing a commissioning/decommissioning step where the resulting action has already been applied to the asset in question. The user will have the option of ignoring the warning, which will cause step execution to continue. If the warning is not ignored, then step execution will be stopped.
Using the Assessment Tool
The Assessment Tool allows you to mark conductors as assessed and clear the assessment mark on conductors that should not be marked as assessed.
To open the Assessment Tool, select Assessment Tool... from the Viewer's Tools menu.
The Assessment Tool displays two panes that provide the status of selected conductors:
• The To Assess pane displays conductors that are not marked as assessed.
• The Assessed pane displays conductors that have been marked as assessed.
Note: If you have not selected any conductors prior to launching the tool, both panes will be empty.
Launching the Assessment Tool
1. Enable the Assessed Highlighting option in the Hide/Display dialog box. See Hiding and Displaying Viewer Objects for information on using Hide/Display.
2. Select Assessment Tool... from the Viewer's Tools menu.
Assessment Tool Toolbar Button Actions
Action | Pane | Toolbar Button |
|---|---|---|
Mark a conductor as assessed. See Marking Conductors as Assessed for details. | To Assess | |
Remove the assessed status from conductors. See Removing the Assessed Status from Conductors for details. | Assessed | |
Focus the Viewer on a selected conductor. | To Assess, Assessed | |
Remove conductors from the list. See Removing Conductors from the Lists for details. | To Assess, Assessed |
Note: All of the toolbar button functions are available from right‑click context menu options when conductors are selected in a list.
Marking Conductors as Assessed
To mark conductors as assessed, perform the following steps:
1. In the Viewer, select the conductors that you want to mark as assessed. The selected conductors will be added to the To Assess pane.
Note: You can select multiple conductors.
2. Select one or more conductors in the To Assess list and click the Assessed button () in the toolbar. The conductors are moved to the Assessed list and they receive the assessed highlight color in the Viewer.
Removing the Assessed Status from Conductors
To undo the assessment status, select one or more conductors in the Assessed list and click the Undo button (). The conductors are moved to the To Assess list and their highlight color is removed.
Removing Conductors from the Lists
To remove one or more conductors from either the To Assess or the Assessed lists, select the conductors in the list and click the Remove button ().
Using the Save Case Management Tool
A study session ‘Save Case' is the collection of changes made during a study session. The Save Case Management tool displays a table with rows for any existing save cases. The tool allows you to create a new save case containing the changes made during a current study session or, like resetting your study session to Real-Time or Nominal mode, you may set your study session based on an existing save cases.
Note: Only topology changes are included in a save case.
Opening the Save Case Management Tool
If you are creating a new save case, you would perform asset operations prior to opening the Save Case Management tool. Conversely, if you want to start a study session based on an existing save case, you would not want to perform any asset operations because the model will be reset to the topology as it existed when the save case was created.
To open the Save Case Management tool, do the following:
1. Start a Study Session. See Real-Time and Study Mode for more information.
2. From the Viewer's Options menu, select Study Mode, and then select Save Case Management....
Note: This option is also available from the Web Switching Steps tab's Reset context menu.
Save Case Management Tool Menus and Toolbar Options
File Menu
Option | Description | Toolbar Button |
|---|---|---|
Print | Displays the Print Preview dialog box, which allows you print the Save Cases table. | |
Exit | Closes the Save Case Management tool. |
Actions Menu
Option | Description | Toolbar Button |
|---|---|---|
Save Case Details... | Displays the Save Case Details dialog box with the save case details for the selected row. | |
Reset | Real-Time: resets the current study session to the real-time model. | |
Nominal: resets the current study session to the nominal model. | ||
Selected Save Case: resets the current study session to the save case for the selected row. | ||
Save... | Opens the Save Case Details dialog box with the steps from the current study session. | |
Delete... | Displays a confirmation dialog box before deleting the selected save case. |
Help Menu
Option | Description | Toolbar Button |
|---|---|---|
Save Case Help | Opens the Oracle Utilities Network Management System's online help content for the Save Case Management tool. | -- |
Save Case Management Tool Data Fields
The Save Case Management tool's table contains the following information:
The Save Case Name field displays the name of the save case.
• The Description field displays a description added to the save case.
• The User field displays the name of the user who created the save case.
• The Created Date field displays the date when the save case was saved.
• The Base field displays the model that the save case was created against.
Creating a New Save Case
To create a new save case, you will first perform operations in study mode and then open the Save Case Management tool.
1. In the Save Case Management tool, click the Save... button () to open the Save Case Details dialog box.
2. Enter a name for the save case in the Save Case field.
3. Enter a description for the save case.
4. Click the Save button to save the save case.
Note: If a row was selected in the Save Case Management tool's Save Cases table, the Save Case and the Description fields will be populated with the name and description of the selected save case. If you click Save, an Overwrite Save Case? dialog box will ask you if you want to overwrite the save case with the operations in your study session.
• Click Yes to overwrite the save case.
• Click No to go back to the Save Case Details dialog box and enter a new name and description.
If you select a row in the Save Case Management tool, but want to create a new save case, click outside of a table row to deselect the row.
Understanding the Save Case Details Dialog Box
The Save Case Details dialog box contains fields, buttons, and a data table listing the operations performed in a study session.
Save Case Details Fields
The Save Case Details dialog box contains the following fields and buttons:
• The Save Case field allows you to enter a name for the save case.
• The Description field allows you to enter a description for the save case.
Save Case Details Buttons
• The Save button saves the save case with the name entered in the Save Case field. The button is only sensitized when a name has been entered.
• The Help... button launches online help for the Save Case Management tool.
• The Cancel button closes the dialog box without saving any changes.
Save Case Changes Table Fields
The current study session's operations are listed in the Save Case Changes table. The Save Case Changes table contains the following information:
• The Operation field displays the type of operation performed.
• The Asset field displays the operated asset's ID.
Viewing an Existing Save Case
When you click the Save Case Details... button () or double-click in a row in the Save Case Management tool table, the Save Case Details dialog box is displayed in viewing mode.
The save case details are displayed, along with a Reset to Save Case and a Delete button. The Reset to Save Case button resets the current study session to the displayed save case. The Delete... button deletes the displayed save case.
Viewing Asset Event History
Event History offers a table summary of events for the currently selected asset and optionally, all downstream assets. The events are chronologically ordered by start date with the most recent event being first, but can be sorted by any of the other columns by clicking on the column header. You can access Asset Event History by selecting Asset Event History... from the Viewer's right click context menu.
Note: Your system administrator sets up the columns available in the event history table by configuring the event_history database view.
Understanding the Select Scope Pane
This pane allows you to define both how many and what kinds of events are displayed, either by filtering the events to be fetched and/or by limiting the number of events fetched.
• Asset Scope: Defines whether to fetch events for just the current asset (default) or for all assets downstream of this asset found by a trace.
Note: If the device is de-energized, a Nominal trace is used to find the downstream assets.
• Event Status Scope: Defines whether to fetch all events (default) or only either Completed or Incomplete events
• Event Type Scope: Defines whether to fetch all events or only either Outage or Non-Outage events.
• Max Events To Fetch: Defines the maximum number of events that match the above scope to fetch. Default is 50.
• Oldest Event To Fetch: Defines a time and date limit of how far back to fetch events. Events will be fetched from the current time back to the time/date defined here. Default is Not Set.
Understanding the Event History Pane
• The Event # column contains the unique number assigned to the event. The event number is also displayed in other Oracle Utilities Network Management System applications in order to track the status of the event.
• The Event Type column indicates whether the event is predicted or an actual outage - see Evt Type column in the Work Agenda.
• The Status column indicates whether the event is predicted or an actual outage. See Event Status Codes for a complete list of status codes and descriptions.
• The Start Time column contains the date and time when the event was reported to have begun.
• The Est Restore Date column contains the date and time when the event is expected to be resolved.
• The Restored Date column contains the date and time when the event was resolved. If this field is empty, then the event has not been completed.
• The Completed Date column contains the date and time when the event was completed. If this field is empty, the event has not been completed.
• The Cause column indicates the Primary Cause option selected when the event is completed; this columns will only be filled in for completed events.
• The Remedy column indicates the Remedy option selected when the event is completed; this columns will only be filled in for completed events.
If you select a row in the table, the context menu allows you to focus the Viewer on the event location or open Event Details.
Note: For some older completed events, the Event Details may not display as the event information may no longer be in the cache.
Understanding Operations Event Note Pane
The Operations Event Note field displays notes entered regarding the selected event. These notes may include crew remarks and resolution issues.