Dashboard

The Dashboard presents an overview in the form of graphical representations of the distribution of all the objects in the instance and across applications installed on it. It helps identify the sharing of metadata across applications and generate a report.
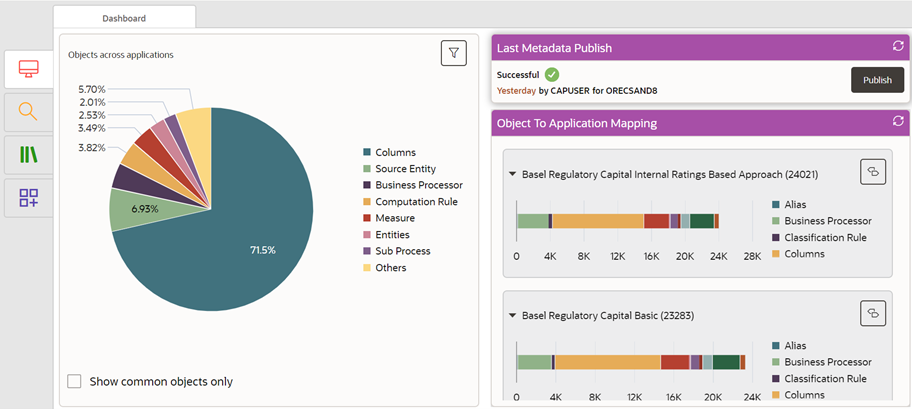
Figure 3-5 The Metadata Browser Dashboard


This illustration displays the Metadata Browser Dashboard, which is the default view of the Metadata Browser. There is a pie chart that represents objects across applications with a legend that describes the type of object in the pie chart. There is additional information on the Dashboard such as the last time the metadata was published with details about the user and the status whether it was successful or not, and graphical representation of object to application mapping.

The Dashboard displays a pie chart of the distribution of metadata objects across all applications in percentage.

To use the pie chart, follow these steps:
  1. Click the Dashboard icon in the Metadata Browser window to display the Dashboard view. The Dashboard view is the default view of the Metadata Browser.
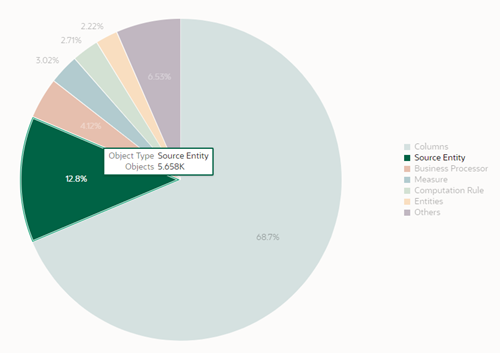
  2. Mouse-over a slice in the pie chart to view the Object Type it represents and the number of objects in it.

    Figure 3-6 Mouse-over to View the Object Type and Number of Objects


    This illustration displays an example for how to use the mouse-over feature on the pie chart. The example shows the other object type representations blurred out and only the mouse-over slice for the object type source entity being displayed with details for the number of objects in it and the percentage that the slice of source entity represents in relation to the total number of object types.

  3. Click a slice to view the list of objects represented by it as shown in the following illustration:

    Figure 3-7 View the List of Objects from the Pie Chart


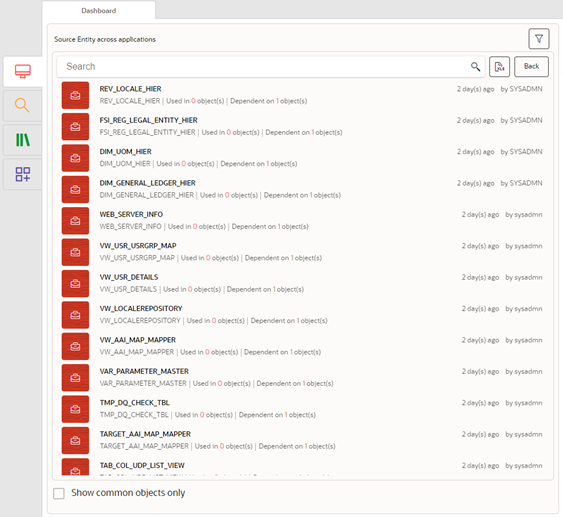
    This illustration displays how a user can select an object type from the pie chart on the Dashboard and view the list of objects for the object type. There is a search bar on the top to enter specific key words and filter the search. The objects are listed in rows and users can select a row to view the object details. The window also displays a filter at the top and is accompanied by a convert object details to XLS format report button and a back button to go back to the previous window.

  4. In the list of objects pane, you can view all the objects of the selected object type with details such as object name, object code, the object used in the number of objects, the object dependent on the number of objects, and audit details such as the time since the object was last modified and the user who last modified the object.
    In this pane, you can do the following:
    1. Click the object name link to view its details. For more information, see Viewing Object Details.
    2. Click the MS Excel icon to export the metadata details of the selected object type to an MS Excel file.
    3. Click Back to go back to the previous view.
    4. Select Show common objects only to display the objects that are commonly used in all the applications.
    5. Click the View Applications Drawer icon to View the Metadata Sharing Information Across Applications.