5.4.8 Using Correlation Tab
About Correlation Tab
A Correlation is defined as a group of events, which are associated with one another based upon matching a set of criteria as defined by a correlation rule.
This correlation is referred to as the source correlation of the case and events, which are members of that correlation become events linked to the case. The Correlations tab provides information regarding the source correlation and the business associations of the events linked to the current case. You can view the source correlation that resulted in the automatic creation of the case, if applicable. In addition, the Correlation tab provides a complete listing of the business entities correlated with the events linked to the case, regardless of whether or not those entities become part of a correlation.
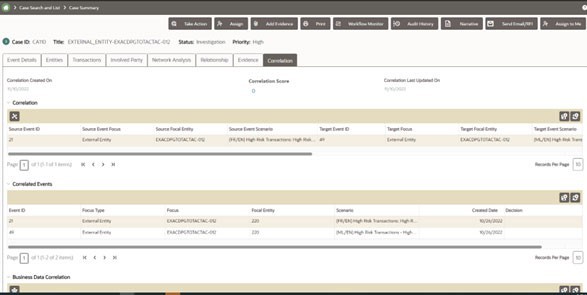
Figure 5-5 Correlation tab

Viewing Correlation Details
This section provides you details of correlation rule, the date on which it is created, the date on which it is updated, and score details.
To view score details breakdown, click the Score link. The breakdown of the correlation score is displayed. For example, Event Score, Entity Score, Correlation Score, and Adjustment Score.
Viewing Correlation
The Correlation section is displayed the correlation that is the source and target of this case creation.
The Correlation section is displayed only when the case was created due to promotion of events. If the case is manually created, this section is collapsed and does not possess any correlation information. A message is displayed, indicating that no source correlation is associated with this case.
Correlation provides information about events that are correlated based on the correlation rule that is set by the client. For more information, see the Administration and Configuration Guide.
- Navigate to the Case Summary page.
- Click the Correlation tab. Go to the Correlation section. The following
correlation details are displayed as described in the following table.
Table 5-8 Correlation
Column Name Description Source Event ID Displays the source event ID. Source Event Focus Displays the focus of source event. For example, Account Source Focal Entity Displays the focal entity of source event Source Event Scenario Displays the scenario of the source event ID. Target Event ID Displays the target event ID. Target Focus Displays the focus of target event Target Focal Entity Displays the focal entity of target event Target Event Scenario Displays the scenario of the target event ID. Common Entity Displays the common entity of source and target Common Entity Type Displays the common entity type of source and target Source to Common Entity Relation Displays the relation of the common entity with source focus. Target to Common Entity Relation Displays the relationship through which the source and target events are correlated. Note:
Based on the parameters configured in correlation rule, thecorrelation engine identifies the source to target event mapping. - Click Ok.
Viewing Correlation Network
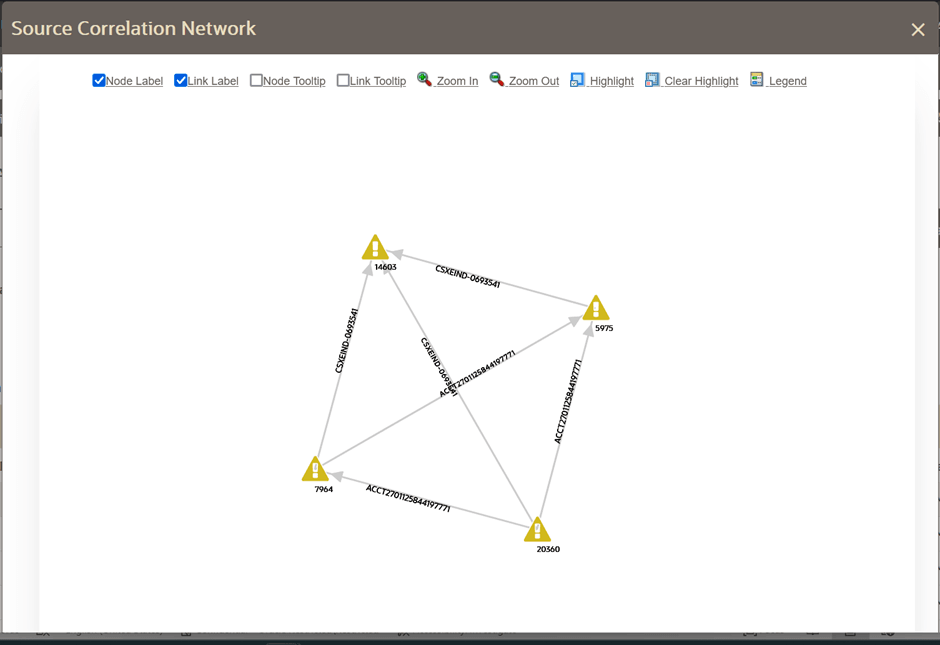
The Correlation Network page is displayed events that are correlated with different business entities using a correlation rule. The Correlation Network page provides a graphical representation of the relationships between entities and other events. The graph starts from the eventing entity (event's focal entity which is also called a node). The graphical representation is supplemented with another event/entity (node) and relationship identified between the nodes (events and entities).
The Network Visualization graph displays the following grids.
- Navigate to the Case Summary page
- .Click Correlation tab.
Go to the Correlation section.
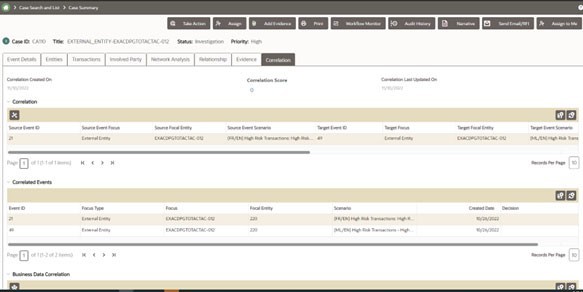
Figure 5-6 Correlation section

- Click Correlation Network.
The Correlation Network page is displayed.
Figure 5-7 Source Correlation Network

For more information on how to view Correlation Network using various features, see Using Network Graph.
- Navigate to the Case Summary page.
- Click Correlation tab. Go to the Correlated Events section.
The following table describes the correlated events details.
Table 5-9 Linked Events
Column Name Description Event ID Displays the linked event ID. Focus Type Displays the focus type of event. For example, Account. Focus Displays the focus event of linked event Focal Entity Displays the focal entity for linked event ID Scenario Displays the scenario of the linked event ID. Created Date Displays the creation date of event ID Decision Displays the decision status of the linked event ID.
Viewing Business Data Correlation
The Business Data Correlation section displays the business data correlated to the selected event.
The Business Data Correlation section displays a distinct list of business entities to which the currently selected linked event is associated. In addition, it displays the total number of distinct events to which each displayed business entity is correlated. By default, the section includes up to ten of the most recent correlated business entities.
- Navigate to the Case Summary page.
- Click Correlation tab. Select a record from the Correlated Event section.
The following table describes the business data correlation details for the selected linked event. By default, the business data correlation details of the first record of the linked event are displayed.
Table 5-10 Business Data Correlation
Column Name Description Entity Displays the concatenated value of the business entity type code and the business entity identifier. Relationship Displays a translated data path name for each business entity to event correlation. Total # of Correlated events Displays the total count, including the current event of the distinct event to which the business entity is correlated. - Click Entity link. The Entity details window is displayed with the complete details of the corresponding entity.
Viewing Business Data Correlation Network
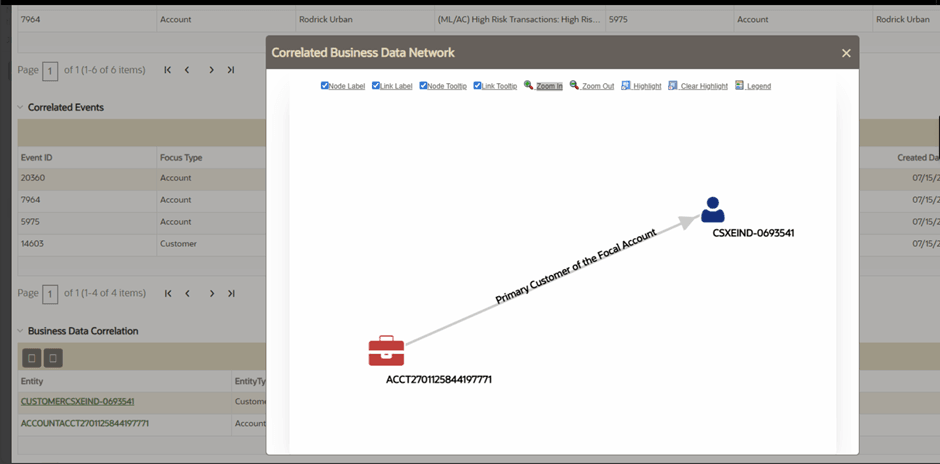
The Business Data Correlation Network page provides a graphical representation of the relationships between business data correlated to the selected event.
- Navigate to the Case Summary page.
- Click Correlation tab. Go to the Business Data Correlation section.
- Click the Business Data Correlation Network. The Business Data
Correlation Network page is displayed.
Figure 5-8 Correlated Business Data Network screen

For more information on how to view Business Data Correlation Network using various features, see Using Network Graph.
Viewing Linked Events
This section displays all linked events currently associated with the case. If there are events which are unlinked, then those events do not display in the section.