Debugging Performance Issues in the Data Entry Window
Performance profiling can provide Oracle Support with diagnostic information for all the activities that are conducted in the Data Entry window for a particular user session.
In addition to the log files for the application pages and for data entry, RDC lets you monitor performance in different parts of the code. RDC supports performance profiling for the data entry client and for the data entry server code.
For more information, see:
Parent topic: Collecting Debug Data
Performance Profiling for the Data Entry Client
You can monitor the performance of specific requests from the data entry client user interface to get an overall idea of the time spent in different parts of the code.
To profile a single user session:
- Start an RDC session using the following URL:
https://server.domain/rdcadfsrnd/faces/Login?setUpDone=Y&deparams= profile:1
- Open a CRF where you are seeing the problem of interest. Note that because profiling
is turned on, RDC adds the View Profile link to the session
information line above the tool bar:

- Execute the problematic scenario.
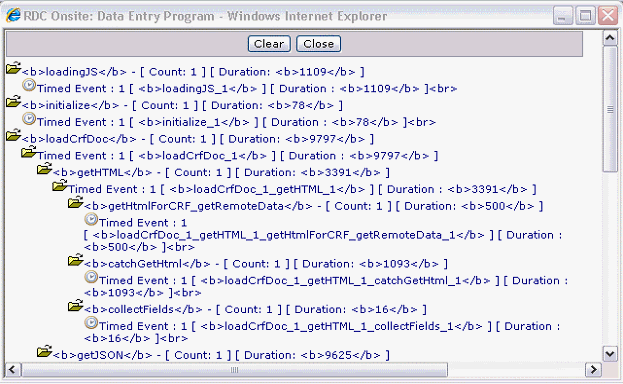
- Click the View Profile link. RDC displays the client profile logs in
a separate window. Note that the log shows the times spent on the client in
different parts of the JavaScript code including network round-trip times.

- Copy and paste information from the View Profile window into a text file that you can forward to Oracle Support. (This information is related only to actions around opening the CRF.)
- Collect the log information and forward to Oracle Support. This includes:
- Content of the View Profile windows that you copied into a text file.
- Content of the application_path\log\requestprofilelog.xml file located on the application server.
On the server side, RDC also creates a new log entry for the same request in the requestprofilelog.xml in the folder as configured in the application_path folder as configured in rdcConfig.properties file. This log entry breaks down the time spent on the server side for the same request in different parts of the code. For example:
<request id="1">
     <user>user@database</user>
     <windowcontext>50645505678382780</windowcontext>
     <profiles>
          <profile name="generateRDciData">484</profile>
          <profile name="loadDciForm">156</profile>
          <profile name="cmdDocData">656</profile>
          <profile name="cmdPostInitialLoad">94</profile>
          <profile name="cmdGetSettings">94</profile>
          <profile name="cmdOpenConfirm">0</profile>
          <profile name="RuntimeController">922</profile>
     </profiles>
</request>
A combination of the client profile data and server profile data gives a complete picture of a request-response life cycle that originated from the data entry client code.
Parent topic: Debugging Performance Issues in the Data Entry Window
Performance Profiling for Data Entry Server Code
Another kind of profiling supported by the data entry code gives the average, minimum, and maximum times spent in specific portions of the server code over time and across multiple data entry users. All time values are in milliseconds.
To enable server profiling:
- Navigate to OPA_CONFIG_FOLDER. The folder path is determined by the registry entry
opa54, found under
HKEY_LOCAL_MACHINE > Software >
                        Oracle
. - Open the rdcConfig.properties file.
- Set the performanceprofile parameter value to 1.
- Save your changes.
- Restart the OpaServer. See Restarting the OPA Server for details.
- Start the RDC application, and the open a CRF in the Data Entry window.
Because you enabled server profiling, RDC adds the Server Profile link to the session information line above the toolbar in the Data Entry window:

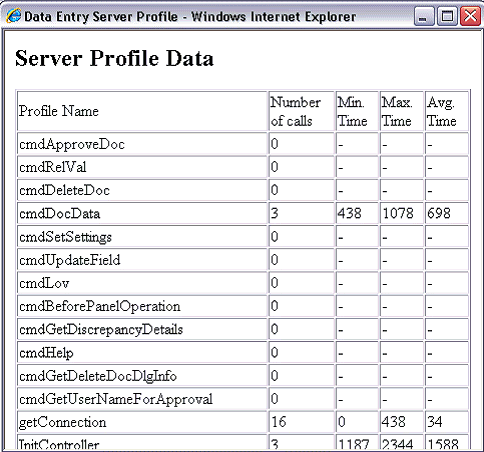
When you click the Server Profile link, RDC opens a separate window with data about the server profile.
The server profile data includes the Profile Name, the number of calls, and the minimum, maximum, and average time. All time values are in milliseconds. For example:

Parent topic: Debugging Performance Issues in the Data Entry Window