View the portfolio key performance indicators
As a user with access to all trials, you can view the key performance indicators (KPIs) that measure study performance consistency across all active ongoing trials in the portfolio for the past 90 days to identify areas of operational risk.
Note:
You can hover over any KPI to see details about how its value was calculated, including the minimum and maximum values, the number of trials used, and the calculation date.- Open the Portfolio Health overview. The portfolio KPIs appear at the top of the overview below the page title and are highlighted in the following example:
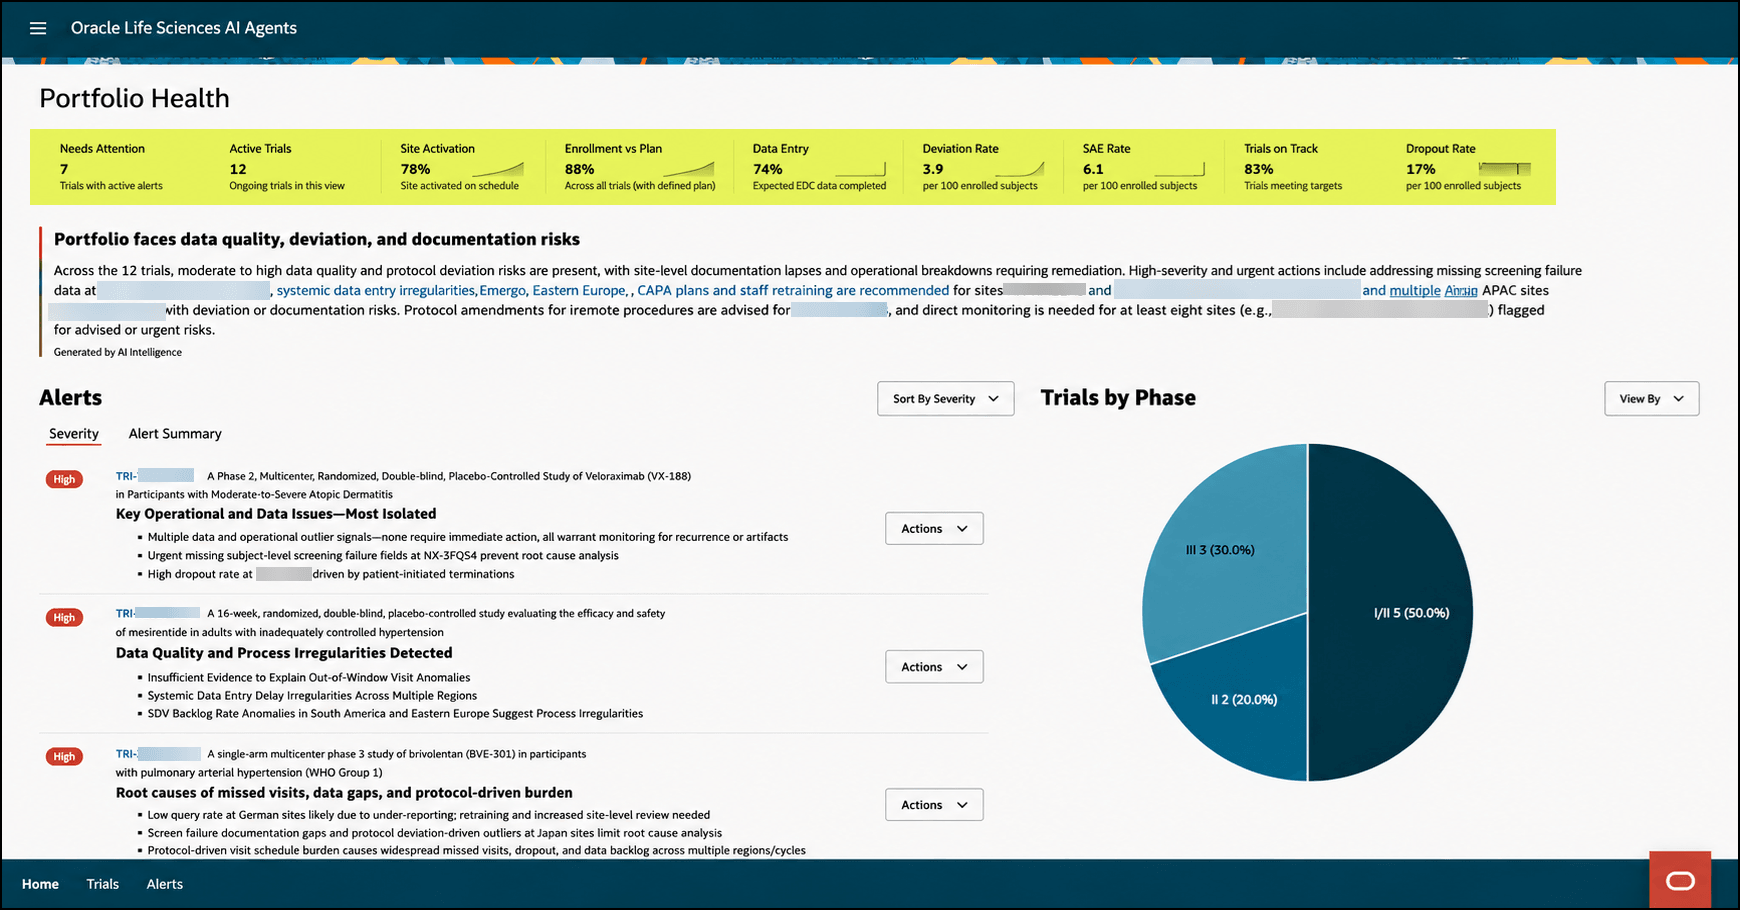
Ongoing Trials Portfolio - Key Performance Indicator (KPI) Description Needs Attention
Count of trials with active alerts (insights). The count depends on the number of active alerts.
Active Trials
Number of active trials users have access to in Life Sciences AI Agents.
Site Activation Percent of activated sites that have met their activation target dates. This metric is a measure of start-up efficiency. A high variance signals bottlenecks.
Enrollment vs Plan Actual enrollment divided by the planned enrollment (uses the enrollment forecast). This metric shows if the portfolio is meeting recruitment goals.
Data Entry Percentage of expected CRFs completed (regardless of query status). This metric serves as an early warning of operational lag. Low data entry completeness correlates to monitoring backlog and slow data entry timeliness.
Deviation Rate Number of protocol deviations reported per 100 subjects across the portfolio or a subset of trials. This metric represents the universal compliance indicator.
SAE Rate Serious adverse event rate per 100 subjects enrolled. This is a key portfolio safety metric that normalizes by exposure (compares safety risks across different studies).
TMF Completeness Percentage of expected documents collected. This metric provides leadership a sense of inspection readiness across the portfolio.
Trials on Track Percentage of trials hitting enrollment targets within ±10% of plan. This executive indicator shows the percentage of studies that are progressing as planned.
Dropout Rate Percentage of enrolled subjects that have dropped out or were terminated early. Appears only if you are not using a supported source application.
Data Entry Timeliness Average number of days from subject visit dates to when the data is entered into eCRFs in EDC systems. This metric provides an early warning signal for downstream delays in cleaning, reporting, and analysis. Appears only if you are not using a supported source application.
Parent topic: Review the Portfolio Health overview