Open the Portfolio Health overview

As a user with access to all trials, you use the Portfolio Health overview to view summary data of the overall health of all active, ongoing trials in a customer's portfolio.

To open the Portfolio Health overview:

  1. Select the Home tab at the bottom of the page. The Portfolio Health overview opens. For example:
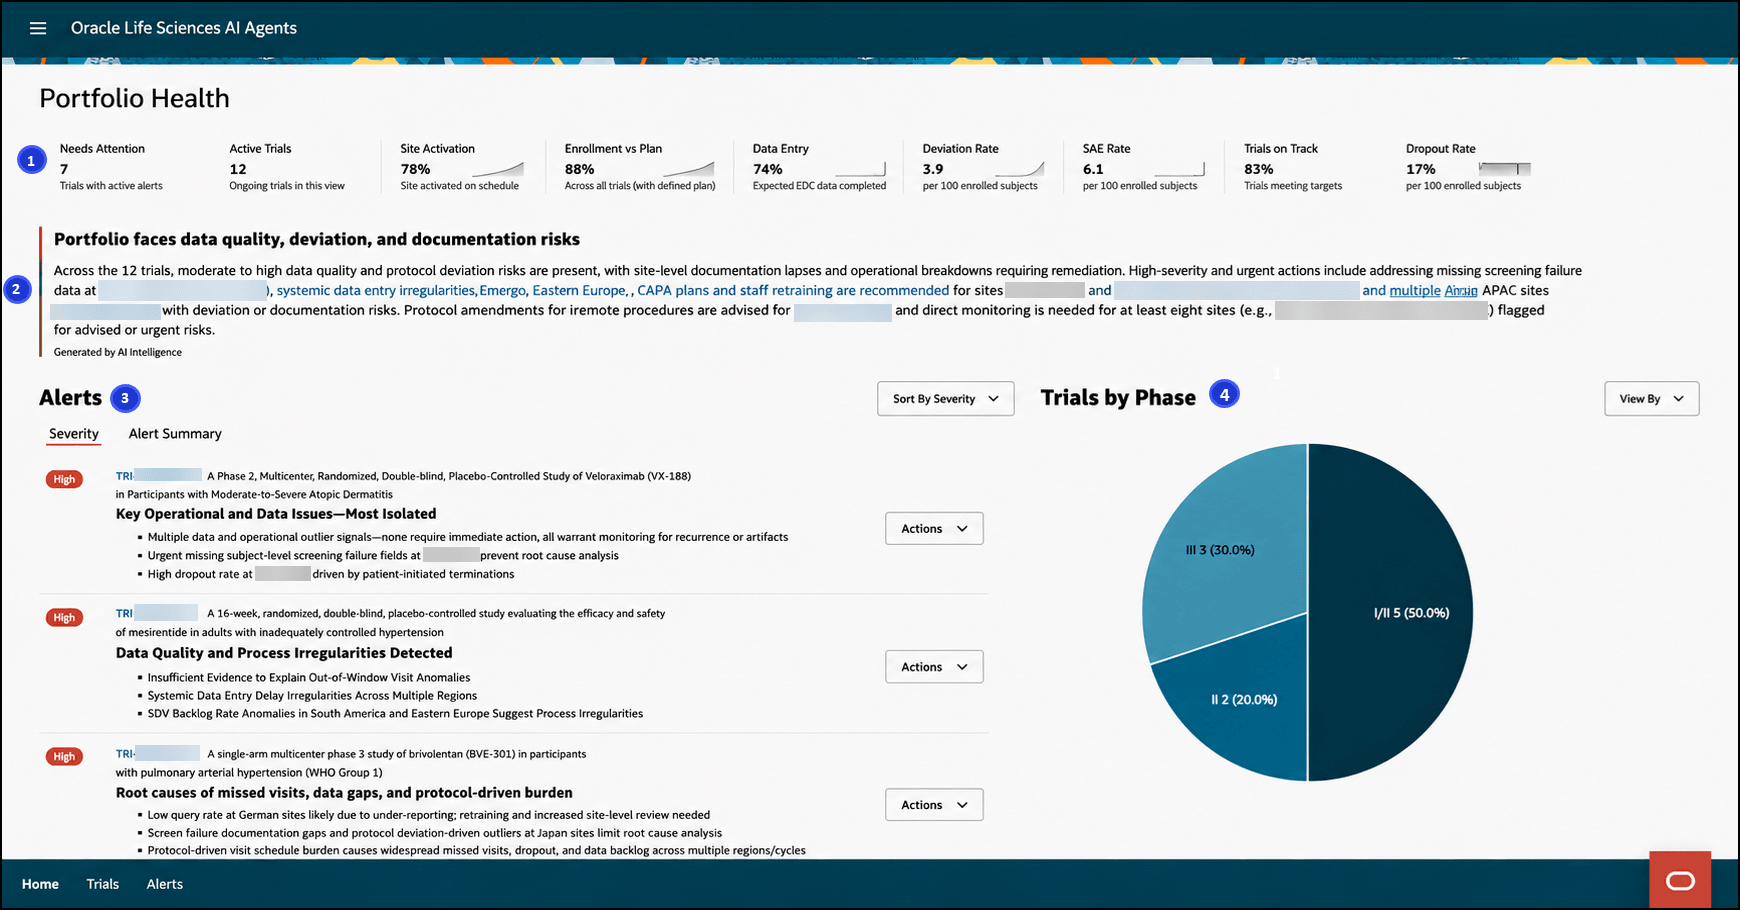
    Portfolio Health overview - Shows number callouts

    Note:

    The Portfolio Health overview provides information for Ongoing Trials only.
  2. The Portfolio Health overview provides the following information:
    • 1 - Portfolio Key Performance Indicators (KPIs)—Standardized measurements of performance consistency across all trials in the portfolio for the past 90 days to identify areas of operational risk.

      The portfolio health KPIs appear across the top of the page below the title. They are refreshed every 24 hours at 2 am UTC and are only calculated and shown if there is enough data for each. The KPIs can include Needs Attention, Active Trials, Site Activation, Enrollment vs Plan, Data Entry, Deviation Rate, SAE Rate, TMF Completeness, Trials on Track, Dropout Rate, and Data Entry Timeliness.

      For more information and descriptions of the portfolio health KPIs, see View the portfolio key performance indicators.

    • 2 - Portfolio Health Summary—An AI-generated text summary of the portfolio health for all Ongoing Trials in the portfolio. The health summary highlights top risks, study-level callouts with direct (deep) links, and cross-portfolio trends impacting efficiency and quality.

      The portfolio health summary appears below the KPIs and provides executives, study managers, and clinical operations leads with access to all trials a consolidated view of the portfolio health by surfacing the most critical risks, trends, and study-level callouts.

      Note:

      The portfolio health summary appears on the Portfolio Health Overview page only if you have access to all trials.

      For more information, see View the portfolio health summary.

    • 3 - Portfolio Alerts—An AI-generated list of the highest priority alerts (for example, insights and recommendations) for all Ongoing Trials in the portfolio. The portfolio alerts provide a concise and regularly updated view of the most critical issues in a customer's clinical trial portfolio, enabling you to quickly respond to emerging issues or trends.

      The portfolio alerts:

      • Show one row per trial and up to three top ranked issues for each trial (each alert provides a link to the Alert details page).
      • Prioritize trials based on risk severity (Critical, High, Moderate, or Low). The default sort of the trials in the list is by risk severity.
      • Provide sorting of the alerts by Severity (default), Trial Name, or Alert Title.
      • Refresh every 24 hours at 2 am UTC. If no trials need attention, a "No trials currently require attention." message appears in the Alerts section.

      The portfolio alerts appear at the bottom left of the page and are prioritized based on risk severity (Critical, High, Moderate, or Low). For each alert you can view its severity, associated trial name, alert title, and alert summary. For more information and descriptions of each alert severity, see View the portfolio alerts.

      From the portfolio alerts list you can:
    • 4 - Portfolio Data Graphs—Data for all the ongoing trials in the portfolio in any of the following selectable formats: Trials by Status (bar graph), Trials by Phase (pie graph), Trials by Therapeutic Area (bar graph), and Enrollment by Region (bar graph). Each graph format includes a timestamp. Hovering over the graphs displays statistic details.

      The portfolio data graphs enable you to tailor the visualization of your trial data to suit your analytical requirements, potentially enhancing your ability to understand and act upon the insights provided by the data.

      The portfolio data graphs appear at the bottom right of the page. For more information and descriptions of the data in the portfolio graphs, see View the portfolio data graphs.