Scenario Results Section
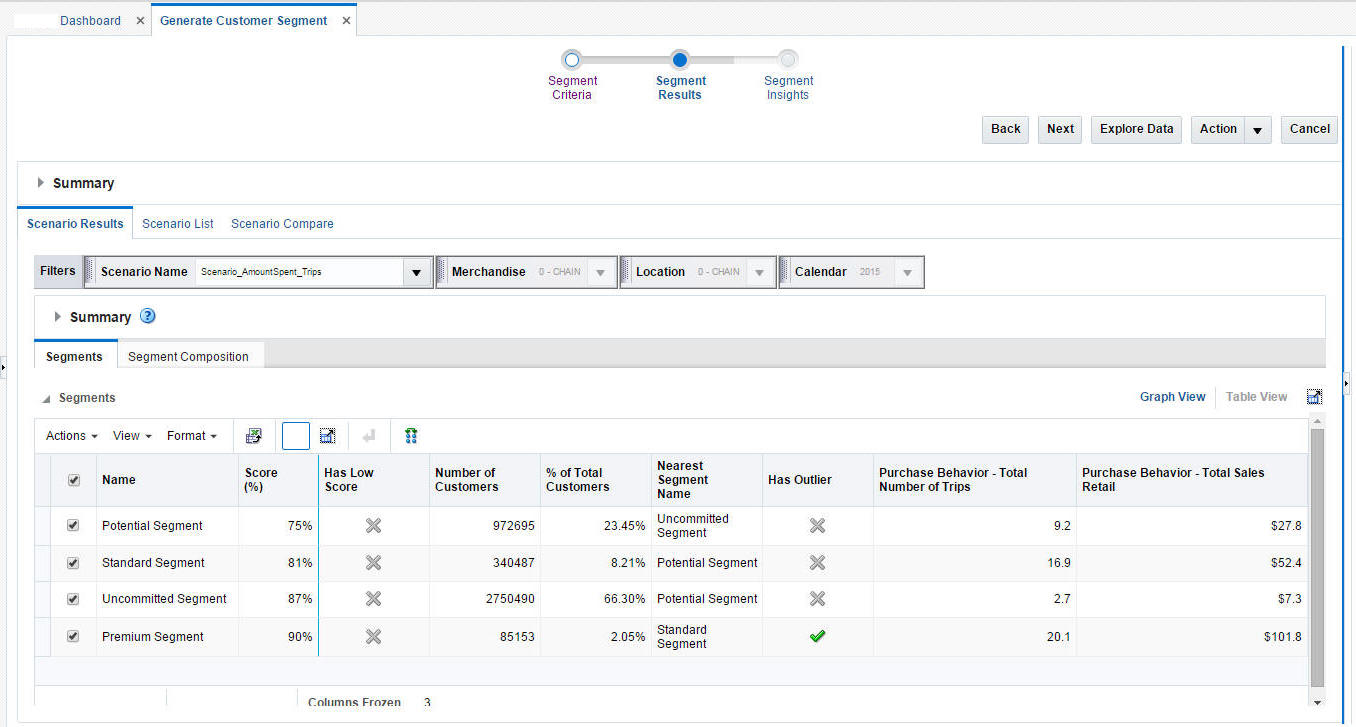
The Scenario Results section displays the following:
-
The Scenario Summary, which provides key segment set attributes for the executed scenario as well as its status.
-
The Scenario Results, which has two tabs: Segments and Segment Composition.
Figure 5-23 Customer Segmentation Scenario Results

Description of "Figure 5-23 Customer Segmentation Scenario Results"
The Summary section provides an overview of the characteristics of the scenario.
Table 5-21 Scenario Results Summary
| Field | Description |
|---|---|
|
Status |
Ready for Preview, Ready for Approval, Approved, Rejected. |
|
Optimal # of Segments |
The optimal number of segments determined by the optimization. |
|
Rank |
The application compares executed scenarios and ranks them. A value of 1 indicates the best scenario. |
|
Max./Min # of Segments |
The number you provided for the maximum and minimum number of segments to calculated. |
|
Largest/Smallest Segment |
Provides the sizes of the largest segment and the smallest segment in order to show the range of values. |
|
Is System Preferred |
Indicates whether or not the system prefers the scenario. |
|
Is User Preferred |
Indicates whether or not the user prefers the scenario. |
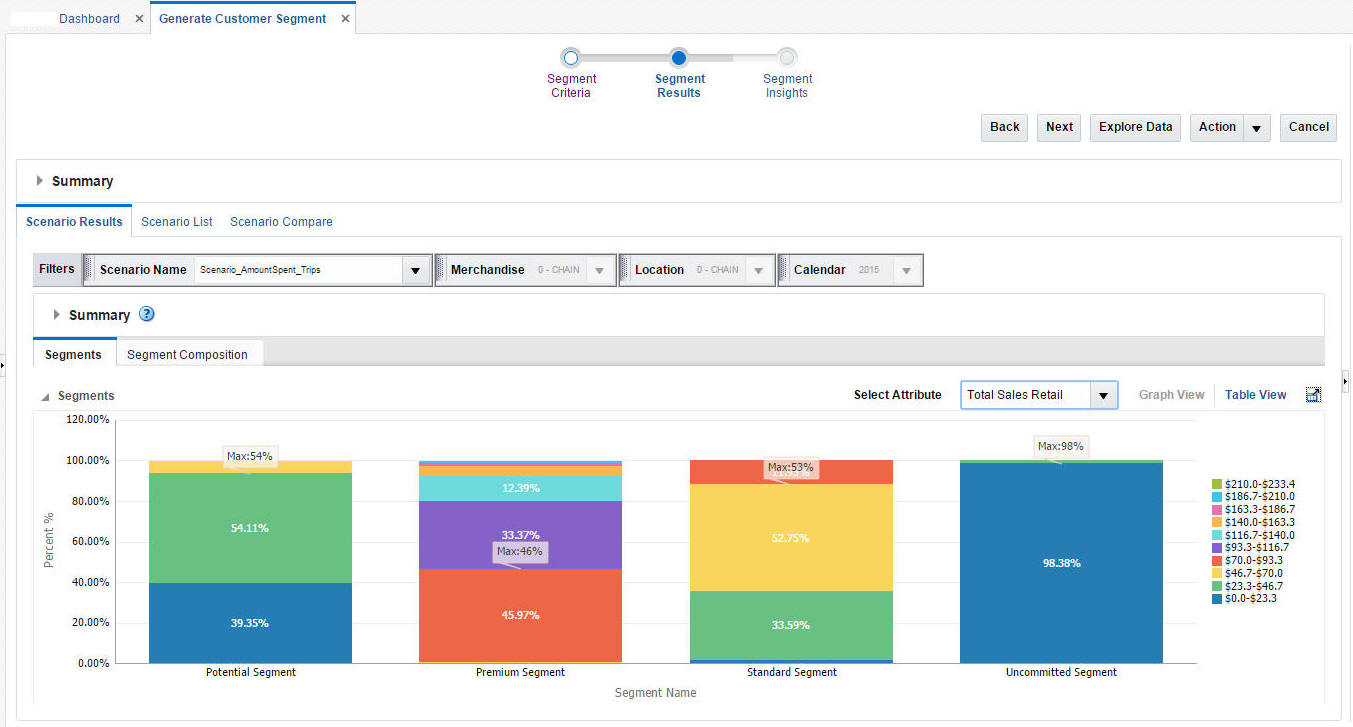
The Segments section provides the segment results for each individual segment in the scenario in either a Graph View or a Table View. The attributes displayed depend on the Segment by option chosen in the Segment Criteria stage.
The Graph View shows the percentage for each attribute in the segment.
The Table View provides details that can help you analyze the segment.
Table 5-22 Scenario Results - Segments: Table View
| Field | Description |
|---|---|
|
Name |
The name you assigned to the segment. |
|
# of Customers |
The number of customers in the segment. |
|
% of Total Customers |
The percentage of the total customers that the number of customers represents. |
|
Nearest Segment Name |
The name of the segment that is most similar to this segment. |
|
Score % |
This value is calculated at the level of customer and then averaged to the segment. The probability, expressed as a percent, of a customer being present in this segment rather than any of the other segments. See Segment Scores. |
|
Has Outlier |
Indicates a segment with the number of customers below a threshold. For example, the number of customers are below certain percentage of the number of customers in a segment. See Outlier Indicator. |
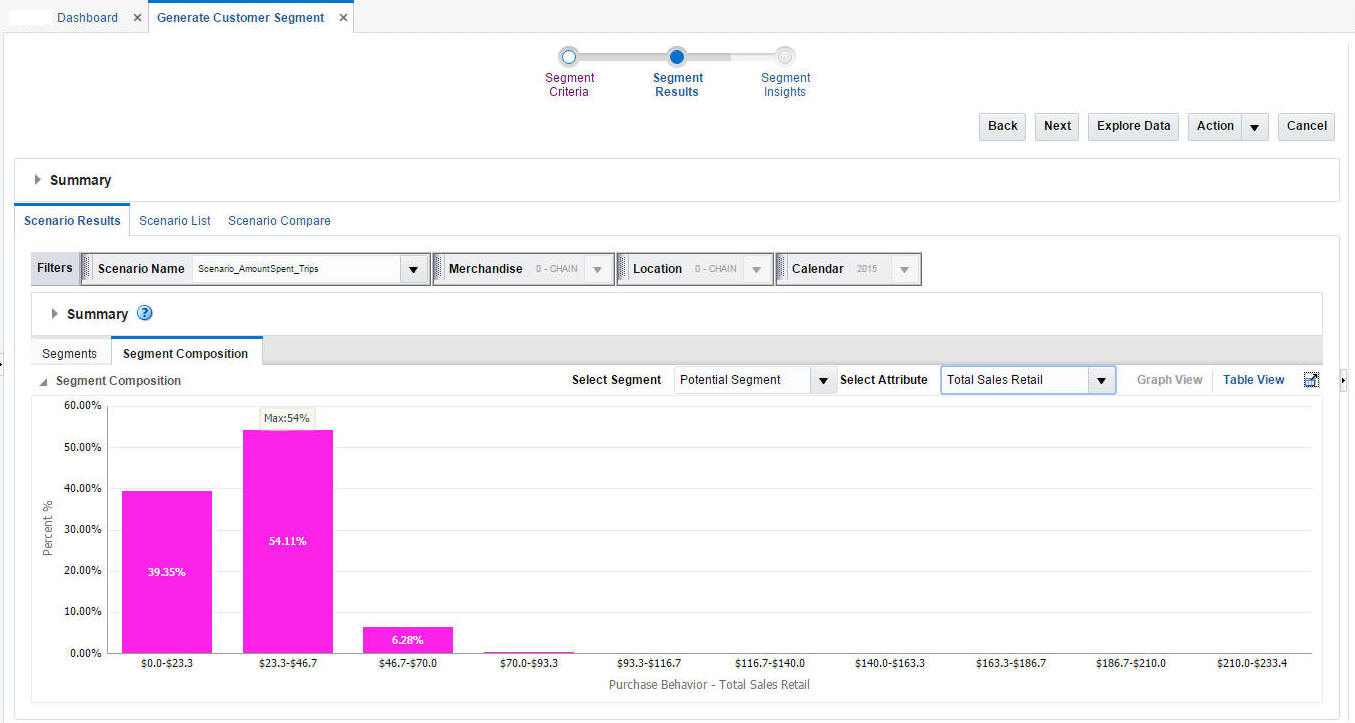
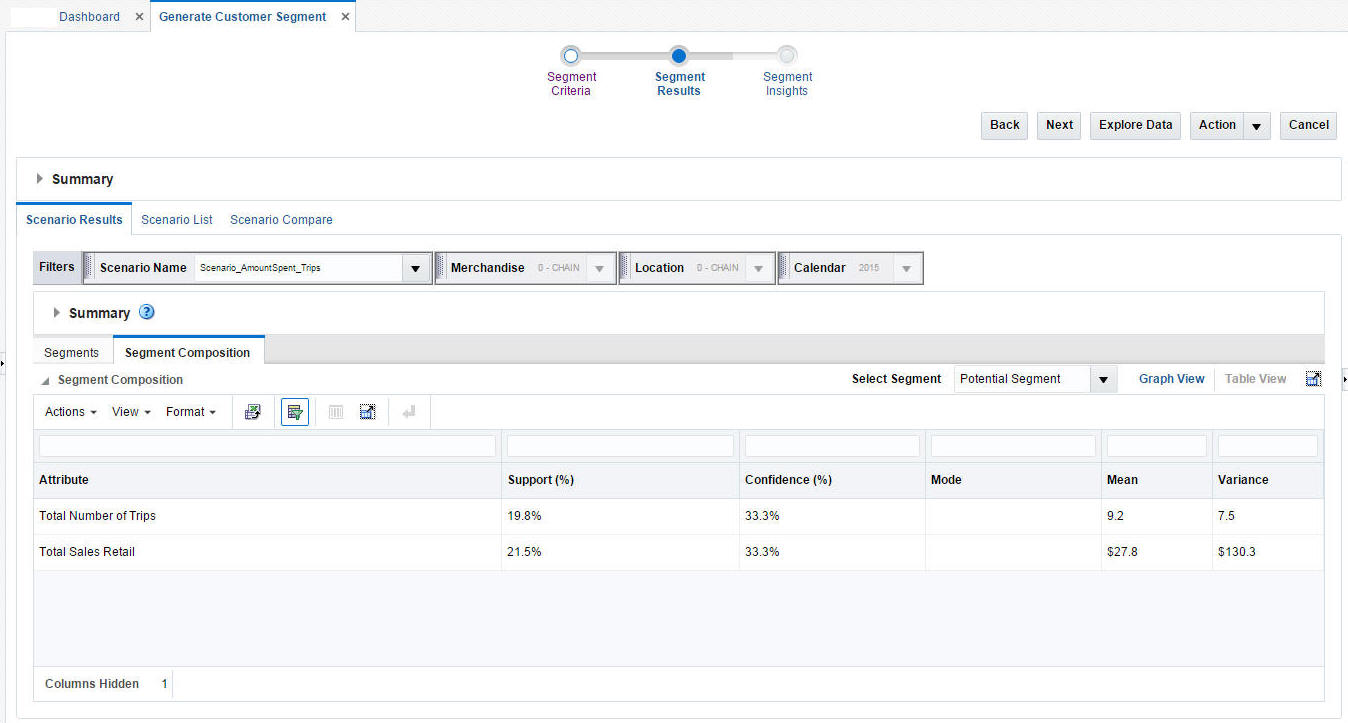
The Segment Composition sub-tab breaks down the segment into its component parts and shows the percentages for each attribute.
The Table View shows attributes, their confidence, and summary statistics within each segment.
Table 5-23 Segments Composition Table View
| Field | Description |
|---|---|
|
Attribute |
The name of the attribute that was used in generating the segment. |
|
Category |
The category name, which is only available for Category Purchase Driven segment by. |
|
Support |
The percentage of the customers that are concentrated within the segment according to the attribute. |
|
Confidence |
Measures the goodness of match between the distribution of the data points for the attribute, indicating the power in recognizing a new pattern in data. An attribute with a higher confidence number plays a more important role in that segment. |
|
Mean |
The average value of the numeric attribute within the selected segment. If no value is available, this is empty. |
|
Mode |
The most common value of the discrete attributes within the selected segment. If no value is available, this is empty. |
|
Variance |
This explains the dispersion from the average for the numeric attributes within the selected segment. If no value is available, this is empty. |
The Graph View shows the segment composition by attribute.
Figure 5-26 Segment Composition Graph View

Description of "Figure 5-26 Segment Composition Graph View"

