3 New Item & Locations Task
This chapter describes the capabilities around forecasting New Items and New Stores. Forecast generation for New Items can be fully automated, while for New Stores the process is manual.
In general, an item is eligible to be considered new if it satisfies the following condition:
-
Forecast start date override is in the future or Sales history length is less than the time series duration parameter
An item is eligible to be considered a Like Item if it satisfies these conditions:
-
Its recent sales density needs to be larger than a threshold or zero for a special case.
-
Its sales history needs to be longer than the time series duration parameter.
-
Finally, we provide the Like Item exclusion mask measure, which can be populated by custom rules through which the implementer can include any other eligibility conditions.
Once a New Item is assigned a system recommended Like Item, it is not processed it in the next New Item batch because it is considered already taken care of.
If you set up the New Item to do manual approve first, all the New Items in the system are handled as manual approval.
In general, if auto approval is turned on, and batch is ran, the items already processed will be skipped in the batch as we only look at refresh New Item in each batch.
These workspaces help you achieve this task:
New Item & Locations Workspaces, Steps, and Views
The following table lists the workspaces, steps, and views for the New Item & Locations task.
| Workspace | Steps | Views |
|---|---|---|
New Item Maintenance Workspace
Note:
There are two workspaces that can help you with setting up New Items for forecast generation:
-
New Item Maintenance Workspace—Use when item attributes are not available and you need to manually select Like Items from the New Item Maintenance workspace.
-
New Item Management Workspace —Use when item attributes are available, the Like Item selection can be automated using the New Item Management workspace.
It is recommended to use only one of the two workspace options, depending on whether or not attributes are available. The other workspace can be easily hidden using Access Rights.
The workflow in the New Item Maintenance workspace starts by selecting the New Items. An item is defined as new if it has a forecast startdate override that is in the future, that is.,past RPAS_TODAY. The date can be loaded in the measure if available. If not, the date can be entered manually. Once you identified the New Item and the forecast startdate override is populated, you can select the substitution method. Depending on your selection, you may need to enter additional information. The workflow message measure guides you through the process. For instance, if you choose the Like Item option, you need to specify a Like Item. If you do not specify a Like Item, the workflow message warns you and displays User Specified Like Item Not Set. You have successfully set up a New Item for forecasting when the workflow message is cleared and the Approval flag is selected. You finish by running the Approve New Items custom menu.
Note:
You can work on multiple New Items and run the custom menu after you have set them all up.
Another helpful tool in the process of setting up New Items is the Workflow Message Count measure. It displays the number of item/store combinations that have been flagged as new, but have not yet been successfully set up. If setting up the New Items was successful, then the measure displays a count of zero.
To build the New Item Maintenance workspace, perform these steps:
-
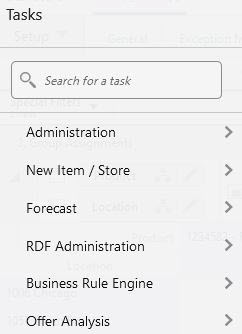
From the left sidebar menu, click the Task Module to view the available tasks.
Figure 3-1 Task Module
-
Click the New Item/Location activity to access the available workspaces.
-
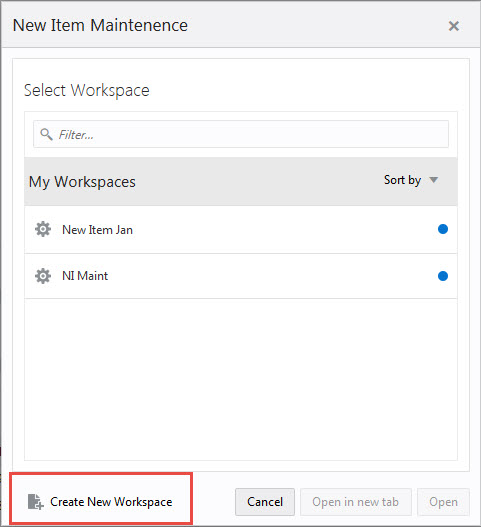
Click New Item Maintenance. The New Item Maintenance wizard opens.
You can open an existing workspace, but to create a new workspace, click Create New Workspace.
Figure 3-2 New Item Maintenance Wizard
-
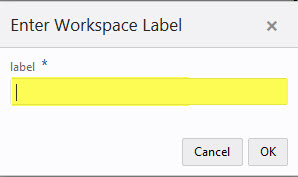
Enter a name for your new workspace in the label text box and click OK.
Figure 3-3 Enter Workspace Label
-
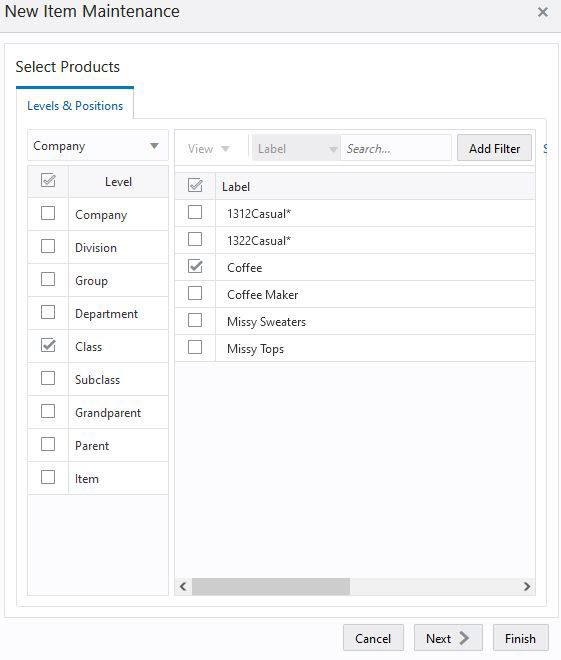
The Workspace wizard opens. Select the products you want to work with and click Next.
Figure 3-4 Workspace Wizard: Select Products
-
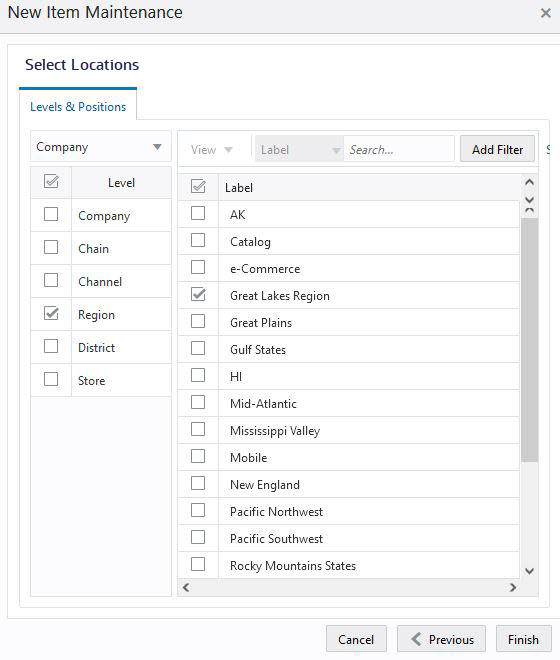
Select the locations you want to work with and click Finish.
Figure 3-5 Workspace Wizard: Select Locations
-
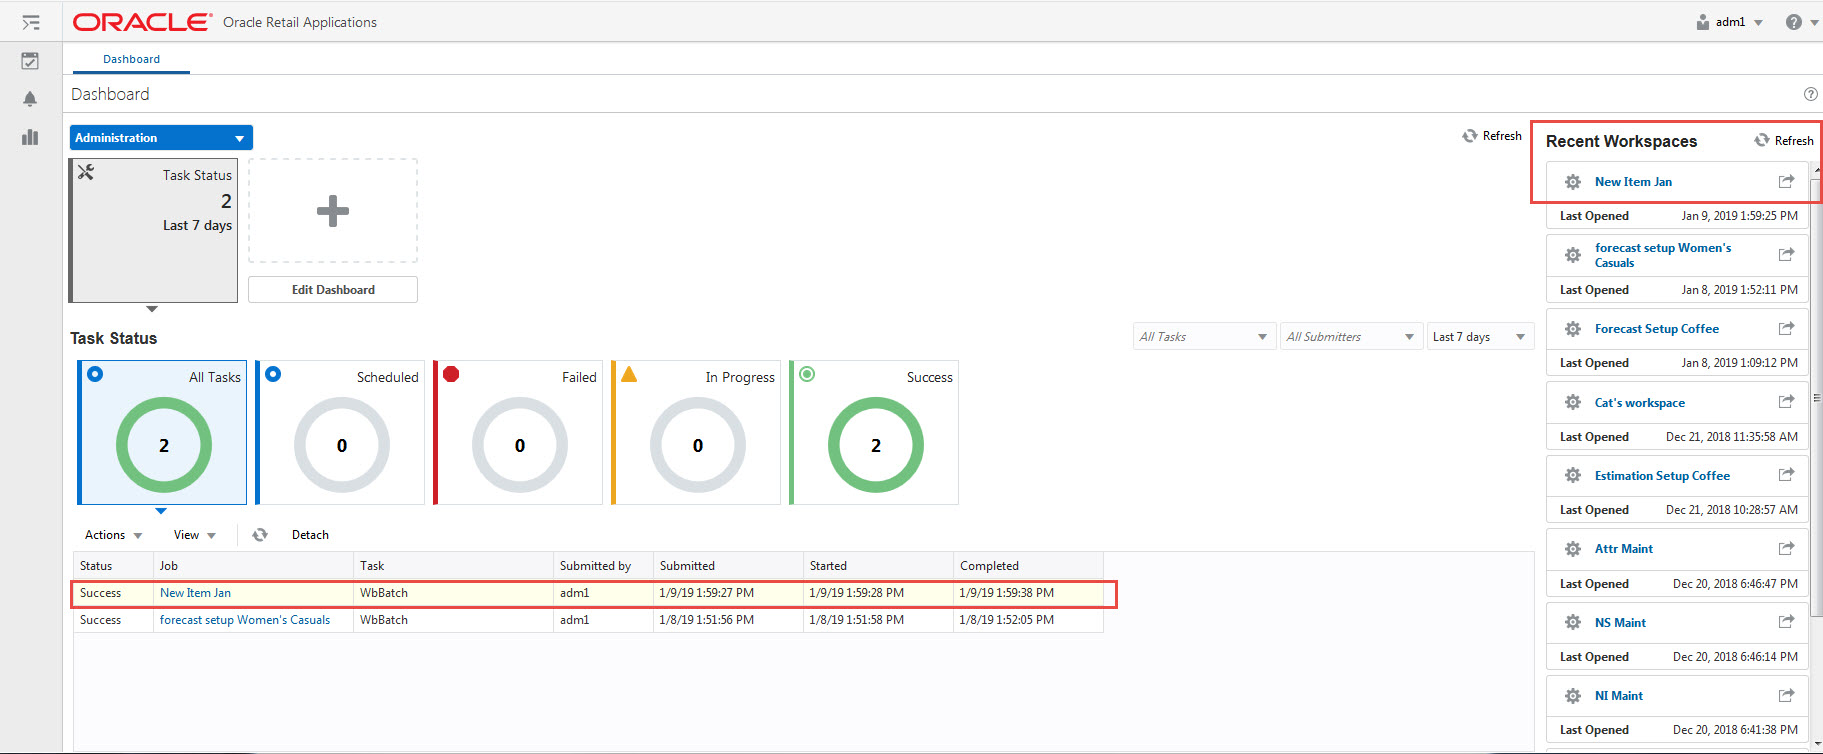
The wizard notifies you that your workspace is being prepared. Successful workspaces are available from the Dashboard.
Figure 3-6 Successful Workspace Build
New Item Basic Parameters View
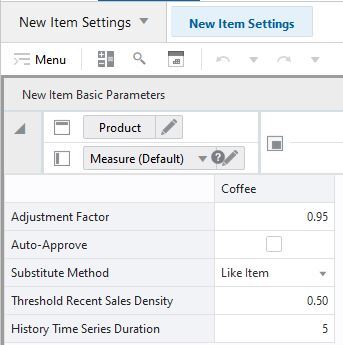
The New Item Basic Parameters view allows you to set default values for some parameters related to the New Item functionality.
Figure 3-7 New Item Basic Parameters View
Measures: New Item Basic Parameters View
The New Item Basic Parameters view contains the following measures:
Adjustment Factor
The only demand component needed to generate forecast for New Items is base demand. If the Like Item substitution method is selected, the adjustment factor specifies what percent of a Like Item's base demand will be copied to the New Item.
Auto-approve
You decide if automatic Like Item recommendations are automatically approved by selecting this measure. If the automatic Like Item recommendations are not automatically approved, the system suggested Like Items are still displayed, but not used in forecast generation.
Substitute Method
This measure displays a list where you can select the substitute method. When a Substitute Method is used to forecast, the method set for an intersection is cleared once the Default Forecast Start Date is greater than the Forecast Start Date Override plus the Like TS Duration for the intersection. Valid options are:
| Substitute Method | Description |
|---|---|
|
None |
No forecast is created for the New Item. |
|
Like Item |
The forecast is created using the base demand of a Like Item. The Like Item is selected in the User Selected Like Item measure in the Like Item - Select and Approve view. The forecast of the New Item is given by: Base demand New Item = base demand Like Item * Adjustment Factor
|
|
Base Rate of Demand |
RDF CS calculates the escalated base rate of demand. The forecast for the new item is given by:: Forecast at time t = base rate of demand (coming from escalation level) * seasonality at time t (coming from escalation level) * promo and price effects (coming from pooling level) |
|
User Input |
This method is very similar to Base Rate of Demand, with the difference that you have to manually specify a base rate of demand. The forecast is then generated using the same formula as for Base Rate of Demand. |
Threshold Recent Sales Density
In this measure, you enter the threshold for the data density. If the actual density is larger than the threshold, the time series qualifies to serve as Like Item/location for a new/item/location. The data density is calculated as:
data density = number of periods with demand larger than zero / total length of demand
For a time series with the following demand values:
0,1,0,1,0,today
The data density is 2/4 = 50%
History Time Series Duration
In this measure you can enter the threshold for the historical demand duration to determine if a time series is considered. If the demand history is less than the threshold, the forecast of the new time series is generated using the New Item/store functionality. If the demand length is larger than the threshold, the time series is not considered new anymore, and its own demand is used to generate the forecast.
Tip:
Consider the threshold is set to five periods, and the first week of sales is 10 weeks ago, In this case, the item is not considered new anymore. Whatever Like Item strategy was selected for the item is not applied anymore and the forecast is generated based on its own demand.
Like Item - Select and Approve Step
This step contains views that allow you to set up the forecasting strategy for New Items.
The available views are:
New Item Statistics View
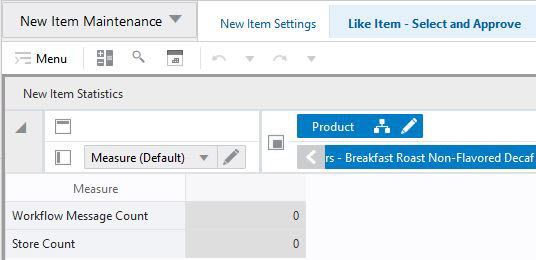
The measures in this view are supporting the New Item setup process that happens mainly in the Figure 3-9.
Figure 3-8 New Item Statistics View
Measures: New Item Statistics View
The New Item Statistics view contains the following measures:
Workflow Message Count
This measure displays the count of the Workflow Message measure in the Select and Approve view. The workflow messages are guiding you in the New Item setup process. If the count is zero, you have set up correctly all New Items. The count corresponds to the number of New Item/store combinations that you still have to finish setting up.
Store Count
This measure displays the number of stores that a New Items has been set up for.
Select and Approve View
This view enables you to set up your New Items for forecasting. Depending on the strategy you select in the Substitution Method, you can choose a fully automated process, or you may need to enter additional information. The workflow messages are guiding you through the process.
Figure 3-9 Select and Approve View
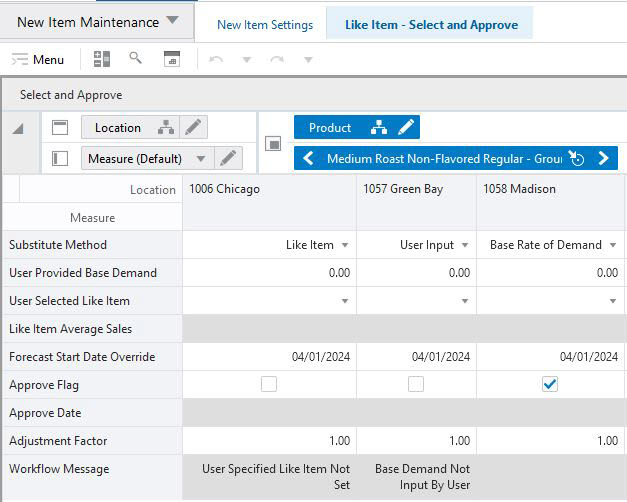
Measures: Select and Approve View
The Select and Approve view contains the following measures:
Substitute Method
This measure displays a list where you can select the substitute method. When a Substitute Method is used to forecast, the method set for an intersection is cleared once the Default Forecast Start Date is greater than the Forecast Start Date Override plus the Like TS Duration for the intersection. Valid options are:
| Substitute Method | Description |
|---|---|
|
None |
No forecast is created for the New Item |
|
Like Item |
The forecast is created using the base demand of a Like Item. The Like Item is selected in the User Selected Like Item measure in the Select and Approve view. The forecast of the New Item is given by: Base demand New Item = base demand Like Item * Adjustment Factor
|
|
Base Rate of Demand |
RDF CS calculates a base rate of demand based on items in the same class (dimension is configurable). The forecast for the New Item is given by: Forecast at time t = base rate of demand * seasonality at time t (coming from escalation level) * promo and price effects (coming from pooling level) |
|
User Input |
This method is very similar to Base Rate of Demand, with the difference that you have to manually specify a base rate of demand. The forecast is then generated using the same formula as for Base Rate of Demand |
User Provided Base Demand
If the User Input substitution method was selected, you have to enter here the base rate of demand that is going to be used for the New Item when generating forecast.
User Selected Like Item
If the Like Item substitution method was selected, you have to select here the Like Item whose base demand is going to be used for the New Item when generating forecast.
Like Item Average Sales
If you selected the Like Item substitution method, and have chosen a Like Item from the picklist, this measures displays the average sales of the Like Item. This is useful because it gives you an idea of the base rate of demand that is going to be used when generating the forecast for the New Item. It is not the exact value because it is recalculated every time the forecasting batch is run, but it is likely be very close.
Forecast Startdate Override
This is a very important measure because it identifies an item as being new. It can be loaded if the information can be interfaced from another system. If not available, you can manually set it.
Approve Flag
When the set up process for forecasting the New Item was successful, this measure becomes True and the measure displays a check mark. You are now ready to run the Approve New Items custom menu to approve the New Item forecast strategy.
Approve Date
This measure displays the date when the Like Item recommendation was approved by running the custom menu.
Adjustment Factor
The only demand component needed to generate forecast for New Items is base demand. If the Like Item substitution method is selected, the adjustment factor specifies what percent of a Like Item's base demand will be copied to the New Item.
Workflow Message
The information in this measure guides you through the forecast setup process for New Items. It informs you on the next steps depending on the substitution method that you selected.
| Message | Cause | Action |
|---|---|---|
|
Substitution Method Not Set |
You have identified a New Item and set the Forecast Startdate Override, but did not select a substitution method. |
Select a Substitution Method |
|
User Specified Like Item Not Set |
You have identified a New Item and selected Like Item as substitution method, but you did not select a Like Item. |
Select a User Selected Like Item |
|
Base Demand Not Input By User |
You have identified a New Item and selected Base Rate of Demand as substitution method, but you did not input a User Provided Base Demand. |
Input a User Provided Base Demand |
|
Existing Item |
You have entered a Forecast Startdate Override for an item that is not new |
Either clear the date to avoid confusion. Even if you do not, no action is taken for the item with respect to New Item forecast setup. |
New Item Base Demand
This measure displays the average Base Demand in the New Item's subclass. This is useful because it gives you an idea of the base rate of demand that is going to be used if you choose Base Rate of Demand as substitution method. It is not the exact value because it is recalculated every time the forecasting batch is run, but it is likely very close. This measure is for information purpose only.
New Item Seasonality
This measure displays the intersection where the New Item's seasonality is calculated. Base demand and seasonality determine the shape and magnitude of the forecast. This measure is for information purpose only.
Custom Menu
There is also a custom menu relevant to this view, Approve New Items.
After you set up the strategy to forecast New Items, then running the custom menu approves the strategy.
The setup includes selecting a substitution method, Like Items, and percent contribution among others.
After running the custom menu the Approve Date measure is populated with the current date.