5 Planning Maintenance and Location Clustering
The Planning Maintenance task is used for Location Clustering, Assortment Period Maintenance, Placeholder Maintenance, and Curve Maintenance.
Location Clustering is a business process where the assortment planner classifies the retailer's location base into multiple groups of locations that are similar in performance, space, or other user-defined attributes. Each cluster contains similar locations according to attribute criteria chosen by the assortment planner, allowing for more efficient management of multiple assortments. Clustering allows you to choose a combination of up to three location attributes, although it is not necessary to select all three. The more attributes selected for clustering, the more clusters will be created. You must balance creating targeted assortments with the workload increase associated with managing more items, suppliers, planograms, and other factors associated with larger assortments. Multiple subcategories and categories can be selected at one time for clustering with all of the subcategories receiving the same set of clusters. Multiple channels may be selected at a time, and each channel may have multiple clusters. All locations within a cluster receive an identical assortment.
If the Advanced Clustering module is also implemented, the location clusters created in Advanced Clustering in AI Foundation can be integrated with the Assortment Planning solution and used in the subsequent steps in the process. Refer to the Oracle Retail Assortment Planning Implementation Guide to understand the integration requirements.
Multiple versions of clusters may be created and assigned to different Assortment Groups, also referred to as buying periods or seasons. In this way, clusters can be specific to an assortment as well as be reused. When creating an assortment period, you will choose a cluster version to be used for that season that will impact the assortments planned.
Key Concepts
This section describes key concepts for location clustering.
Scaled Scoring Methodology
The Scaled Scoring calculation is used to score each location based on its sales performance. Scaled Scoring is a method to rank locations using Sales R, Sales U, Sales AUR, GM R, GM %, or a combination of those metrics to provide a score that normalizes variability if more than one metric is selected for inclusion in scoring. It transforms all metrics into a common and comparable unit of measure, eliminating metric variability. Each location gets a score based on its relative position to the minimum and maximum value of the sales metric selected, from 1 to 100. The lowest performing location gets a score of 1 and the highest performing location gets a score of 100. If multiple performance metrics are selected for inclusion in the calculation, Scaled Scoring uses the weights assigned to each metric to calculate the final score. If a location has no sales performance data, it will not be included in the calculation.
Breakpoint Algorithm
The Breakpoint algorithm splits locations into clusters that have equal intervals, based on a user-defined number of intervals set in the Performance Group measure. You may select up to five performance groups. For example, you could select four performance groups and decide to give Sales U a 100% weight. The system will then review the Sales U for all of the locations that you selected in the wizard, calculate the Scaled Scoring, and break the locations into four groups, calculating the upper and lower boundaries in the process. You can override the upper boundaries if they have business knowledge that suggests a better result. The upper boundary of the highest performance group is always the maximum of the Scaled Scoring of locations.
Optimized Algorithm
The Optimized algorithm is a science-based method (BaNG) that creates optimized clusters utilizing user set parameters. It involves the following:
-
Create many centroids for each cluster based on the number of clusters you want.
-
Based on each location's performance numbers, assign a cluster to the location. With this, there is a set of clusters with locations attached to them.
-
The algorithm then checks the centroid to see if there is a better position for the centroid that gives a better assignment of locations to each cluster.
-
The previous process is repeated until the result of each iteration is better than the previous one.
-
After it is not possible to further optimize, the resulting clusters are returned for review.
Create the Location Clustering Segment
To create the Location Clustering segment:
-
Click Assortment Services in the Task menu. Then, click the Planning Maintenance activity and then the Location Clustering task.
-
The dialog to create New Plan opens. Click Create New Plan.
-
Enter the Plan Label in the text field. Click Ok.
-
In Select Product, select one or multiple categories and click Next. If you select multiple categories, all of them will receive the same clusters.
-
In Select Sales Source, select the sales data source you would like to use and click Next.
The choice of Actual, Forecast, or Plan in this wizard screen determines the performance values in the Location Clustering task:
-
If the retailer has Inventory Planning Optimization Cloud Service-Demand Forecasting, then the IPOCS-Demand Forecasting forecast can be interfaced with Assortment Planning Cloud Service.
-
If Plan is selected, the sales performance data will be based on MFP Location Plan Cloud Service Current Plan (Cp) Sales.
For elapsed periods, MFP Location Plan Current Plan Sales is loaded with actuals. If the calendar periods selected include elapsed periods, the data could include Actuals and Plan.
-
If Actuals is selected but you pick a future time period, you will not see data.
-
-
In Select Calendar, select the time periods to display in the segment. It is recommended that you bring in at least six months of data.
Click Finish. The Location Clustering segment is built.
Step 1: Setup
The first step in the clustering process is Setup. You will review location attribute performance data to determine which attributes should be used for clustering, assign strategy weighting, and determine the methodology to create the location clusters.
Tab and Views in this Step:
Setup Tab
This tab is used to analyze measure values for the location attributes and set up location clusters.
Attribute Analysis View
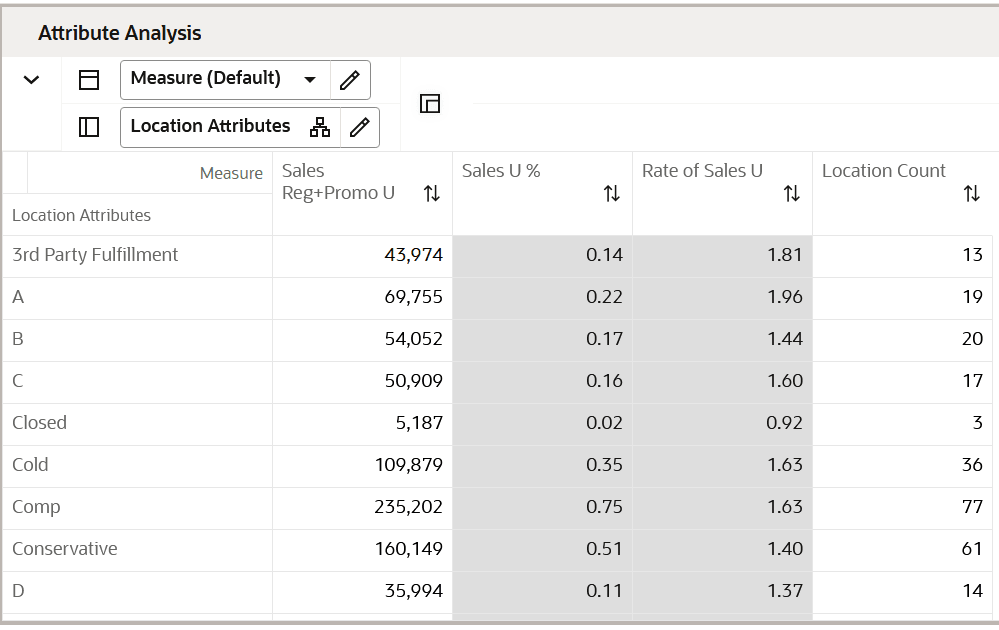
The Attribute Analysis view is used to show attributes that are assigned to each location, along with performance data that corresponds to the Sales Source measure (Plan, Forecast, Actuals) and the calendar periods selected in the wizard process. Reviewing and analyzing the data provides input to you when deciding which attributes to use in the clustering process.
Figure 5-1 Attribute Analysis View
Location Attributes View
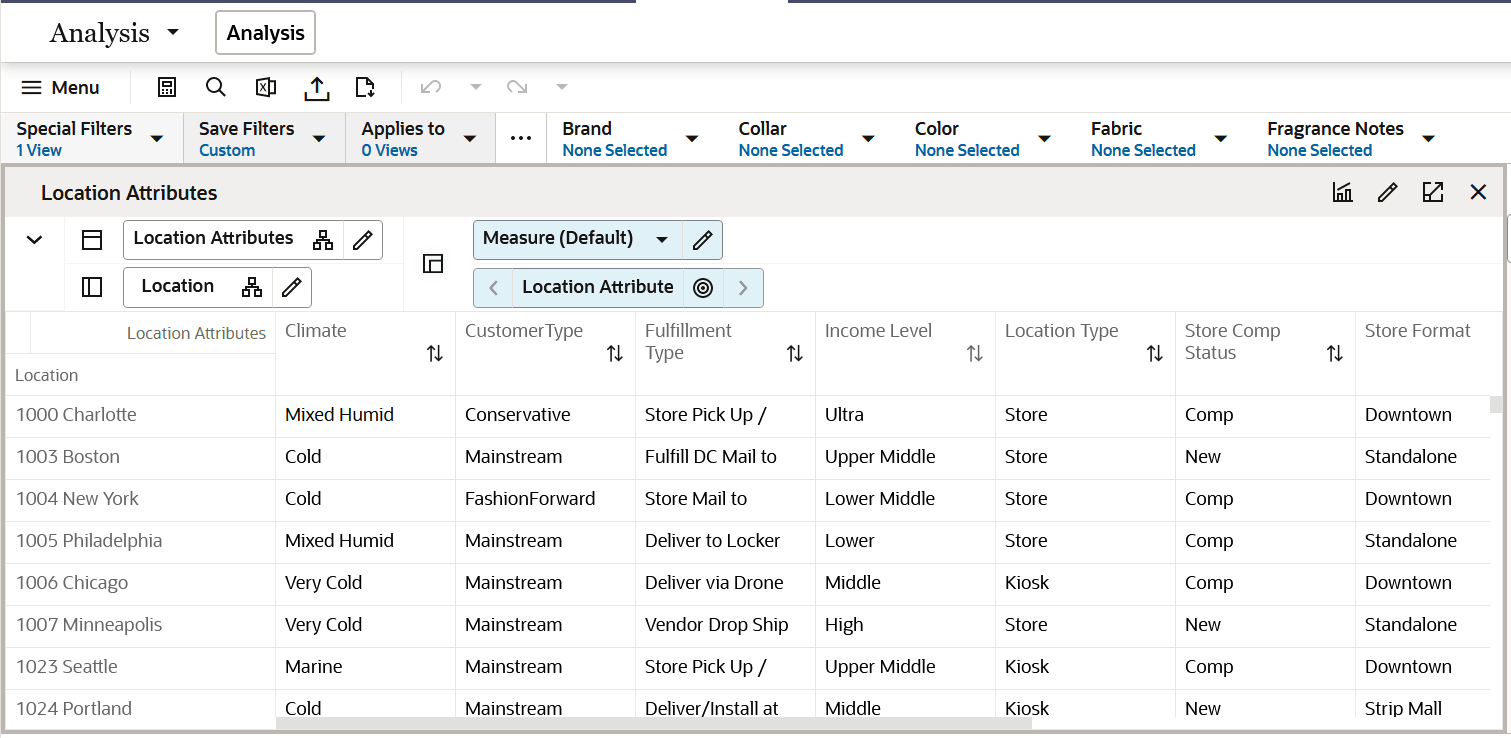
The Location Attributes view allows you to review all the attributes and characteristics defined for every single store. This is a read-only view displaying the data set up in the location setup located in the planning Administration section. You can review the attributes to make key decisions on location clustering.
Figure 5-2 Location Attributes View
Define Location Rollup View
The Define Location Rollup view is used to select Location attributes to view in an alternate hierarchy. This is available in the tab to display the Store level. The Nested Location attribute rollup is provided with three levels. You can set up to three different combinations for nested rollup with a maximum of three levels in each combination. Nesting of dynamic attributes is a configurable option.
You can analyze, review, and edit the clustering decisions based on important attributes. You may select up to three attributes at a time for the dynamic rollup.
Figure 5-3 Define Location Rollup View
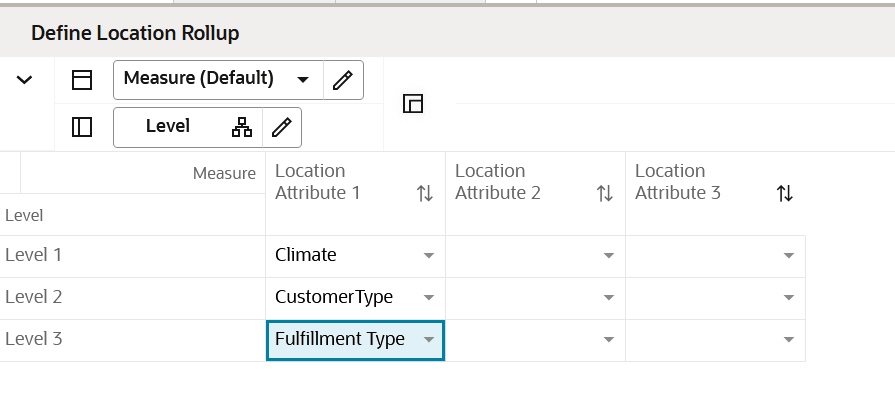
Figure 5-4 Edit View
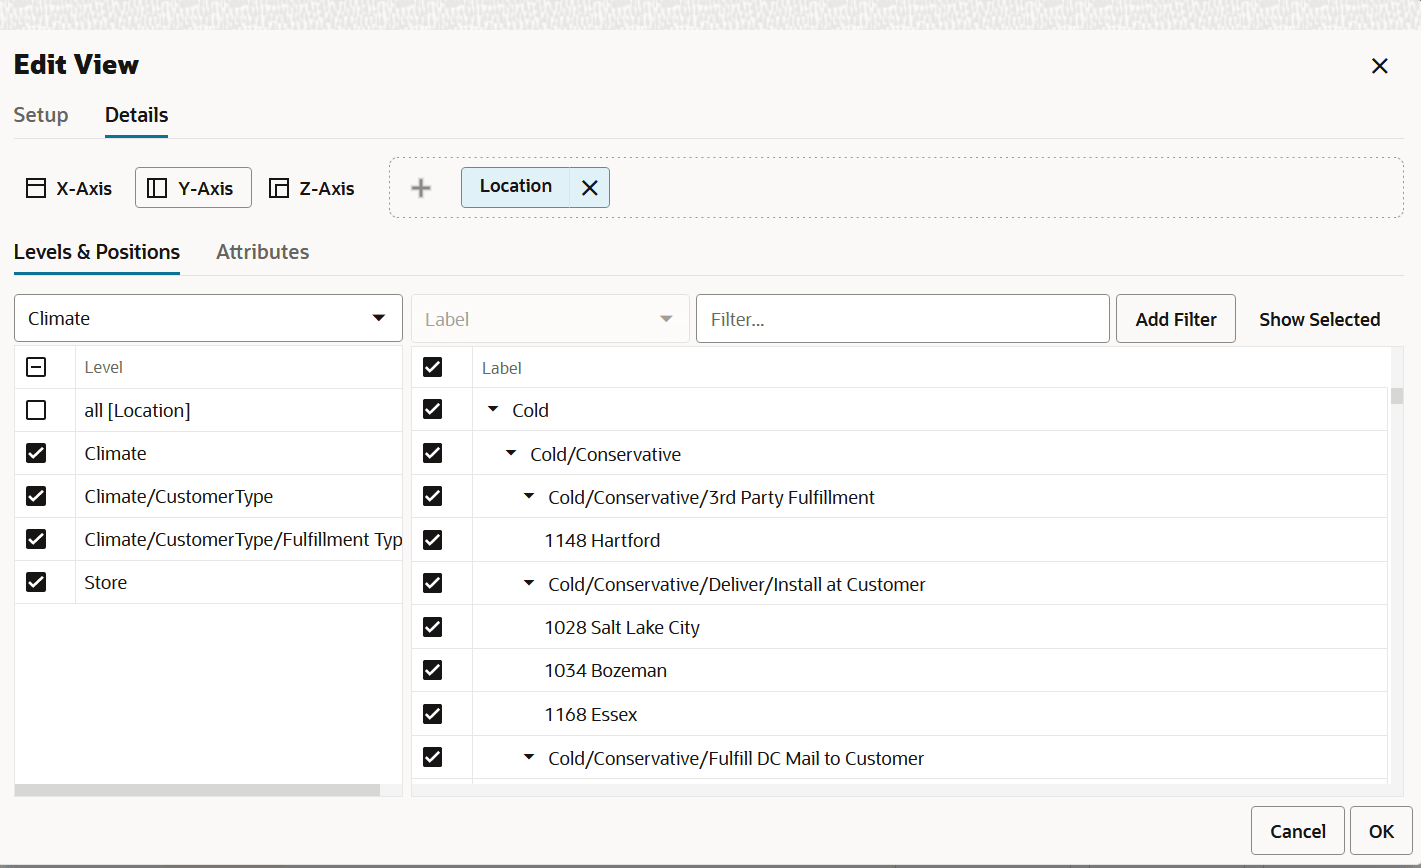
When selecting the alternate dynamic hierarchy defined in the Define Location Rollup View, you can see the subtotals at each nested level. For all the editable measures, you can edit these subtotals to spread the values to all the associated positions.
Clustering Setup View
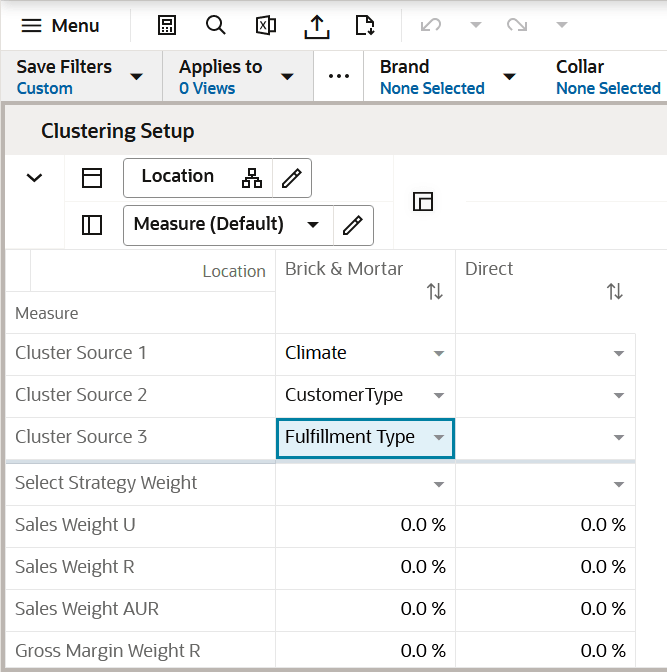
The Clustering Setup view allows you to select up to three location attributes that can be used to create clusters and to seed or assign Strategy Weights for the category, based on business knowledge of the strategy for the category.
Note:
The total sum of the weights assigned to all the metrics should be 100%; if the weights do not sum up to 100%, they are re-normalized upon the next commit and refresh.
Things to consider when choosing the Sales Perf Group attribute:
-
Which performance measure, or combination of performance measures, should I choose? The category strategy should inform this decision. For example, if the category is a traffic driver, then choosing units as the performance metric makes sense. If the category's purpose is to drive profit, then choosing Gross Margin makes sense.
-
How many Performance Groups do I want for this category? You may select from 1 to 5. Selecting 1 is a good option if you do not want to break your clusters down by sales grade. As you select more groups, you will have more clusters to manage, with fewer locations assigned to each cluster.
If the Perf Group Setup is not selected, but at least one other attribute is selected, you can run the Create Cluster Application Action now, since performance and space setups do not need to be created. Keep in mind that as more attributes are selected, more clusters will be created, with a corresponding increase in workload.
Figure 5-5 Clustering Setup View
Sales Perf Group Setup View
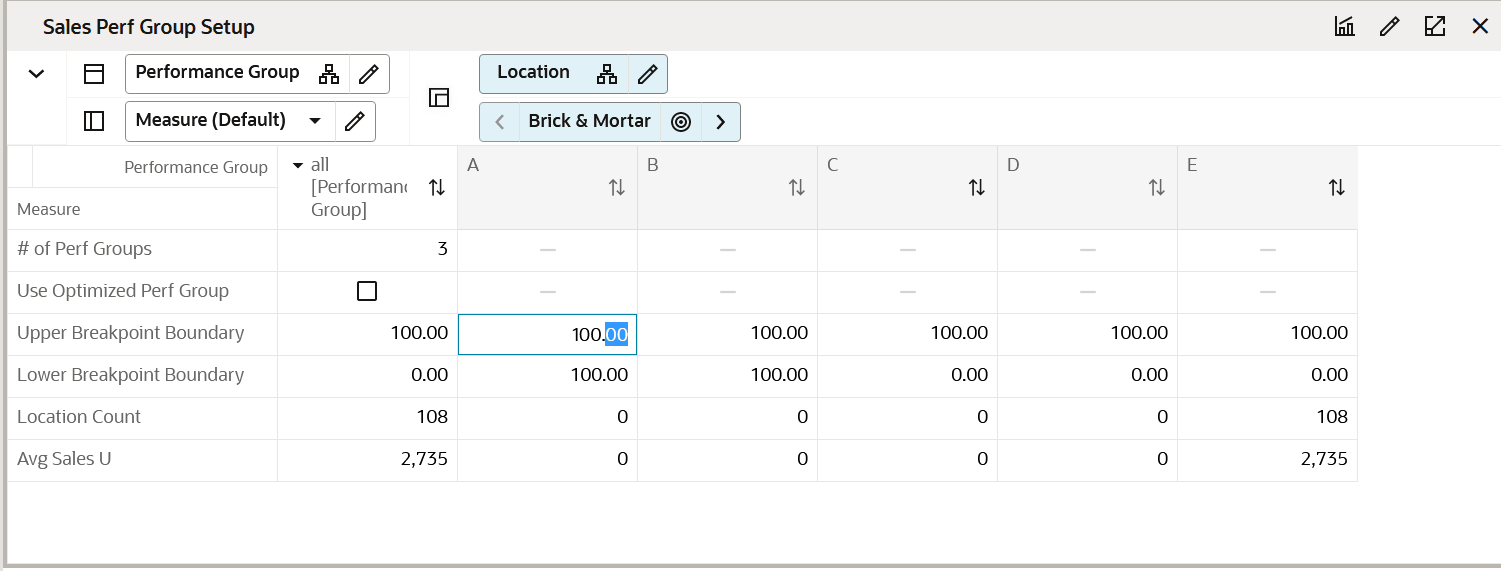
The Sales Perf Group Setup view is used to define the number of performance groups and select the algorithm used for clustering. The maximum number of performance groups is five.
To review the definitions of Breakpoint and Optimized, see Key Concepts
If using the Breakpoint algorithm, the steps to complete this process:
-
Enter the number of performance groups you want to create for the category, with a maximum of five available.
-
Review the Upper Breakpoint Boundaries; adjust the upper boundaries if you have business knowledge that suggests a better result.
If you adjust the upper boundary, it will only be valid for the current session and will not be committed to the segment. When you create a new segment, the system will revert to the recommended values.
-
Review the Location Count and Avg Sales U for each performance group.
-
Run the Create Cluster Application Action to create clusters.
Note:
If you make changes to any settings, you must rerun the Create Cluster Application Action to see updated results.
If using the Optimized algorithm, the steps to complete this process:
-
Enter the number of performance groups you want to create for the cluster, with a maximum of five available.
-
Check the Use Optimized Perf Group Boolean flag.
-
Review the Location Count and Avg Sales U for each performance group.
-
Run the Optimize Clusters Application Action.
-
Run the Create Cluster Application Action to create clusters.
Note:
If you make changes to settings, you must rerun the Optimize Clusters and Create Cluster Application Actions to see updated results.
Figure 5-6 Sales Perf Group Setup View
Step 2: Analysis
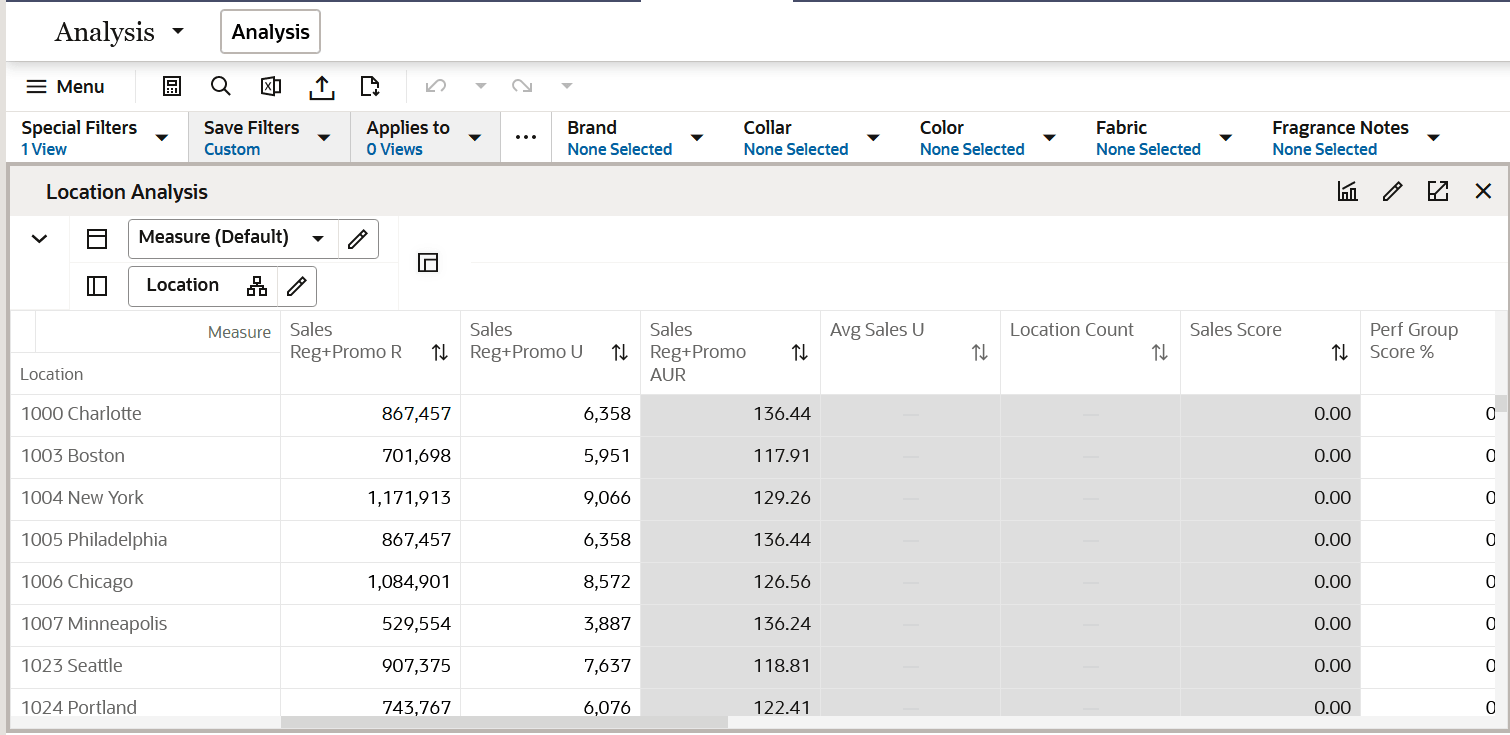
The second step in the clustering process is Analysis. This step allows you to see location performance measures, Scaled Scoring, the related Performance Groups that each location scores into, and the cluster that the location has been assigned to. You can override the performance group a location has been assigned to be based on your business knowledge; overriding a performance group will change the cluster the location is assigned to.
If using Space Groups to cluster locations, select the Space Group Analysis measure profile to view the Space scores, groups and clusters, and to make overrides as necessary.
The output of this step is a thoroughly analyzed and reviewed set of clusters, ready for approval.
Note:
The location attributes, as well as the like-location assignments for new locations were assigned in the Planning Administration segment.
Tab and View in this Step:
Analysis Tab
This tab is used to analyze the location performance measures, scaled scoring, performance groups, and clusters assigned to each location.
Location Analysis View
This view is used to analyze location clusters. It allows you to review the cluster assignments to ensure you agree. If you do not agree with the cluster assignment, you have several options:
-
Override the performance group assignment in the Override Perf Group measure. For example, if a location was ranked as B, you can manually override it to an A or a C, based on your business knowledge.
-
Return to the Setup step to:
-
Adjust performance measures. For example, you could change the performance measure of Sales U to Sales R. Keep in mind that the measures being used should correspond to the category strategy.
-
Adjust performance weights. For example, you could change the weights that are assigned to Sales U to Sales R. Keep in mind that the weights and measures being used should correspond to the category strategy.
-
Adjust the number of performance groups. For example, you could increase or decrease the number of performance-based clusters. This will increase or decrease the number of clusters created.
-
Adjust the location attributes used in clustering. For example, you could choose a different combination of attributes or remove an attribute if you deem it unimportant after analyzing the results.
-
Note:
If you make changes to settings, you must rerun the Optimize Clusters (if using the Optimize algorithm) and Create Cluster Application Actions to see updated results.
Figure 5-7 Location Analysis View
Step 3: Approval
The third and final step in the clustering process is Approval. This step approves the location clusters that you have created, analyzed, and reviewed for accuracy.
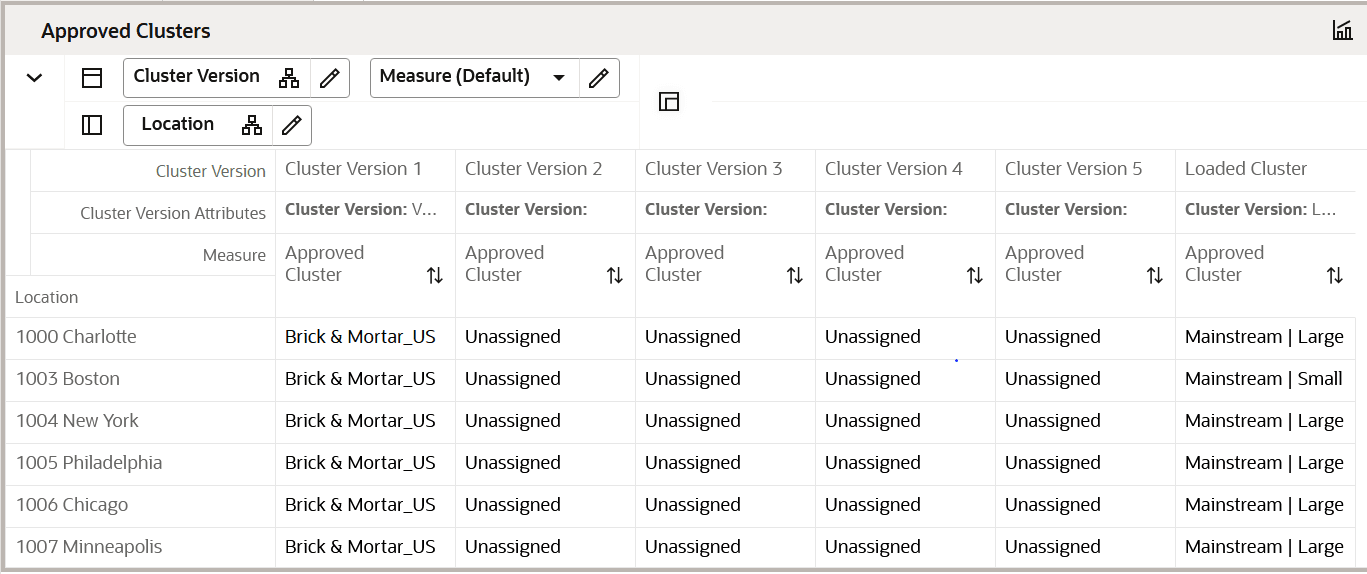
The output of this step is an approved set of clusters, for use in Assortment Maintenance when assigning a cluster to an Assortment Period.
Tabs and Views in this Step:
Approve Tab
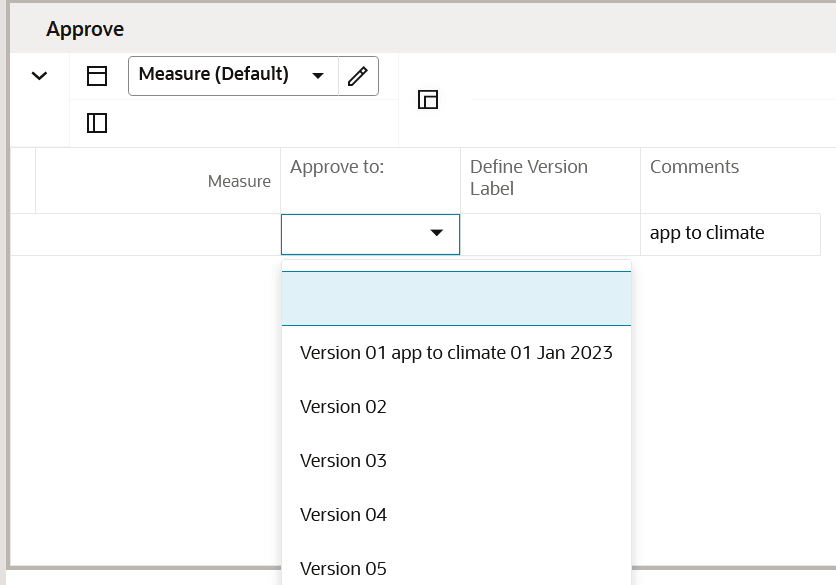
The Approve tab is used to select a version to approve the clusters to define a cluster label if desired and enter comments as necessary. The Approve Application Action creates a version of clusters that can be used to assign to an Assortment Period in Assortment Maintenance. Multiple versions of clusters can be approved, to be reused and assigned to different Assortment Periods. You can select which version to approve to before running the Approve Application Action.
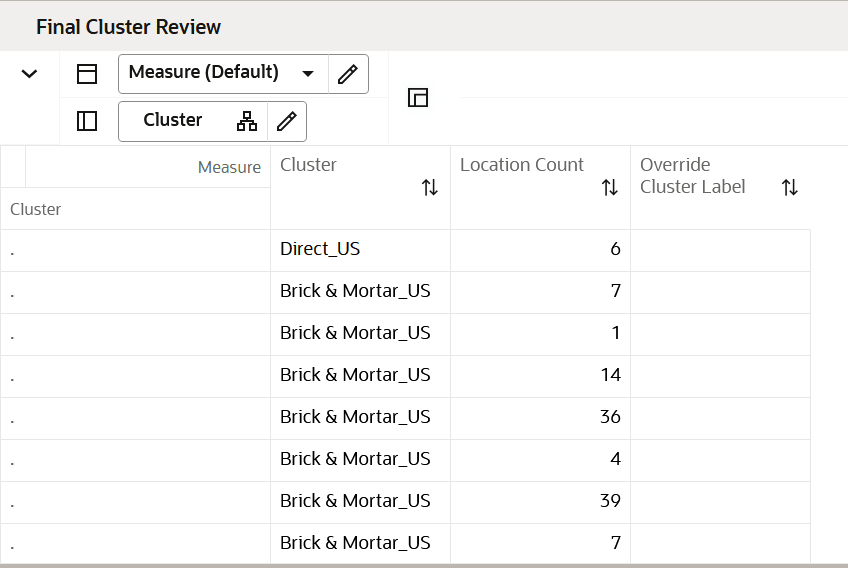
Final Cluster Review View
This view allows you to Review the location count by each cluster. Using the Override Cluster Label column, you can enter new a label name for clusters, if desired.
-
The cluster label can be used to identify the attributes of the cluster.
-
If you use the Override Cluster label, you must run the Approve Application Action after the labels are entered.
Figure 5-8 Final Cluster Review View
Approve View
This view allows you to select and approve a version of clusters to be used in Assortment Planning. The ability to have multiple versions of clusters allows you to have a library of versions that can be assigned to different Assortment Periods. If a cluster version has already been used, you may override its contents by selecting and running the Approve Application Action. Unused cluster versions will have this naming convention: Version01, Version02, and so on.
The Approve Application Action creates a version of clusters that can be used to assign to an Assortment Period in Assortment Maintenance. Multiple versions of clusters can be approved, to be reused and assigned to different Assortment Periods. You select which version to approve to before running the Approve Application Action. The Refresh Cluster Version Application Action displays the version selected in the Cluster Version drop-down list measure. It is used to dynamically update the clusters in order to view different approved versions.
Figure 5-9 Approve View
