7 Curve Maintenance Task
The Curve Maintenance task is used to create a sales curve library for use in the Item Flow task. Curves define how unit sales are distributed across weeks based on percent-to-total sales. Curves adjust to fit the defined selling period, either remaining fixed or resizing based on the selected curve type.
Create the Curve Maintenance Segment
To create the Curve Maintenance segment:
- From the Oracle Home page, navigate to the Oracle Retail icon to open the task selection panel.
- Locate the Curve Maintenance task using the available navigation options or by entering Curve Maintenance in the search field.
- Select the Curve Maintenance task. The wizard dialog opens.
- Click Create New Plan.
- Enter a plan label and click OK.
- In Select Product, choose one or more departments and click Next.
-
In Select Assortment Period, select the assortment period and click Finish.
To see the user-defined Assortment Period label, click the Dimension tile and select Assortment Label.
Note:
Assortment Periods or Labels can vary by Sub-class. If multiple subcategories are selected, the label shown will be based on the first order Sub-class.
Step: Define Curves
The first step in the Curve Maintenance process is to set curve parameters and define the curves.
Tab and Views in this Step:
Application Actions
Seed Curve
Populates an initial sales curve based on the selected seed source and year.
Define Curves Tab
This tab is used to seed and define curves.
Define Parameters View
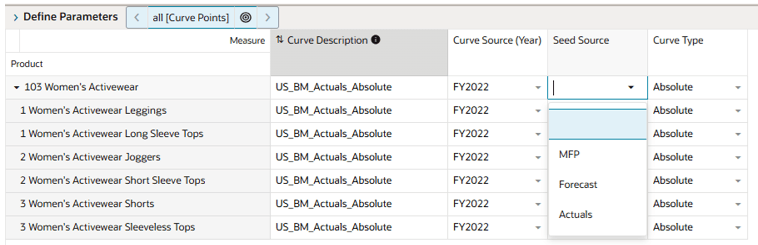
The Define Parameters view is used to define the inputs for curve creation, including the seed source, source year, and curve type.
The steps to complete this process:
- Enter a value in Curve Description to define a meaningful name for the curve.
- Select a value in Curve Source (Year) to define the time period used for seeding the curve.
-
Select a value in Seed Source (MFP, Forecast, or Actuals).
This should align with the Curve Source (Year) selected.
- Actuals for elapsed time periods
- Forecast for future time periods.
-
Select a value in Curve Type:
- Absolute: Retains the original weekly distribution and normalizes values to 100% without resizing.
- Relative: Resizes the curve to match the assortment period and normalizes values to 100% based on the duration of the assortment period (stretches or shrinks).
-
Review alerts:
-
Seed Source Alert
Triggers when the calendar year for the curve source is not defined.
-
- Execute the Seed Curve application action to populate the initial curve based on the selected source and year.
-
(Optional) Enter curve values manually in the Define Curves View instead of using a seed source.
- The system normalizes all values to 100%.
- Use Relative curve type when entering curves manually so the curve will resize according to assortment period duration.
Note:
The Seed Curve application action populates Sales Curve % based on the selected seed source and year, independent of the selected Curve Type.
Curve resizing and normalization occur during calculation, not during the Seed Curve action.
If Relative is selected, the curve will resize to match the assortment period length during calculation.
Curve type (Absolute or Relative) can be selected or adjusted after seeding.
Relative curves are best suited for manually entered or partial curves starting from Week01.
Define Curves View
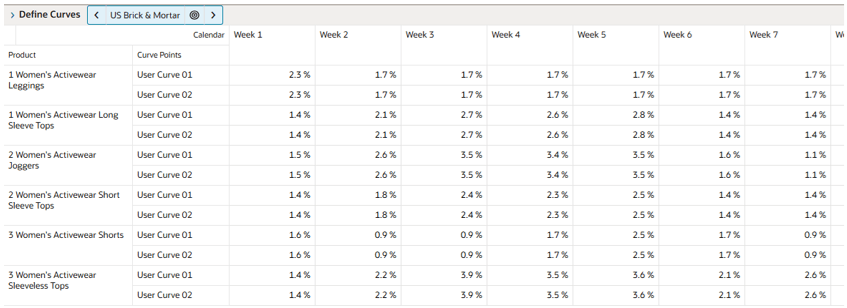
The Define Curves view is used to review and adjust the sales curve distribution across weeks. Curves are expressed as percent-to-total and always normalize to 100%. Planners can modify seeded curves or directly enter curve values. When entering curves manually, the recommended curve type is Relative, so the curve resizes to match the assortment period.
The steps to complete this process:
- Review the defined curves and determine if adjustments are required.
- View the curve in graphical format to evaluate the shape and distribution of demand over time.
-
Review the weekly structure:
- Weeks displayed (Week01–Week53) are relative to the assortment period and do not represent fiscal weeks.
- Week01 corresponds to the first week of the selected assortment period.
- Subsequent weeks align sequentially to the assortment period duration.
View Sales Source View
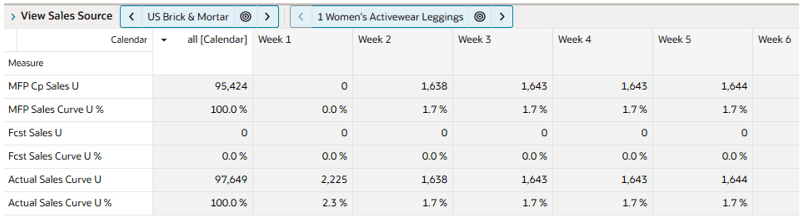
The View Sales Source view displays MFP, Forecast, and Actual sales data for the selected Curve Source (Year). This view provides reference data used to create and validate sales curves, allowing planners to understand the underlying demand patterns before defining or adjusting curves. This view helps planners align curve definitions with actual or planned demand patterns.
The step to complete this process:
- Review the selected sales data to understand demand patterns and validate curve inputs.
Step: Curve by Assortment
This step finalizes the curve library by approving curves and providing visibility of approved curves by assortment period and week. Approved curves are used in the Item Flow task to distribute sales and receipts over time. This step ensures that curve definitions are finalized and aligned to assortment periods before use in Item Flow planning.
Tab and Views in this Step:
Application Actions
Approve
Approves the curve library for the selected sub-class, assortment period, and channel for use in Item Planning.
Curve by Assortment Tab
This tab is used to approve curves and review approved curves by assortment period and week.
Approve View
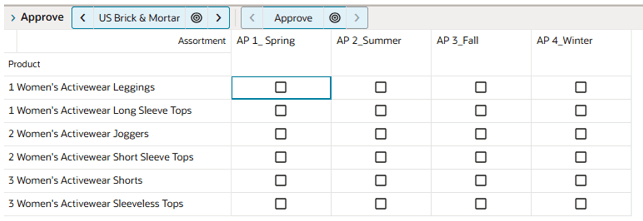
The Approve View is used to approve the curve library.
The steps to complete this process:
- Select the Approve Boolean measure for each sub-class.
- Execute the Approve application action to finalize the curve library.
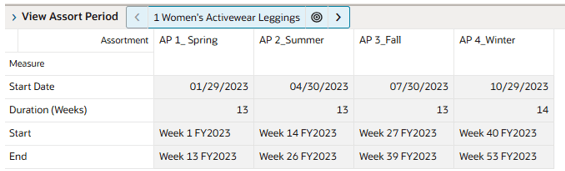
View Assort Period View
The View Assort Period view displays assortment period timing and duration for reference.
View Curve by Assortment View
The View Curve by Assortment view displays the curve library by assortment period and sub-class.
This view allows planners to validate that approved curves align with the assortment period and expected selling patterns.
The steps to complete this process:
- Review the curve library by assortment period.
- Navigate between assortment periods and sub-classes.
- Apply the View Curve by Assortment special filter to display only the weeks corresponding to the selected assortment periods.
