Purchase Profile
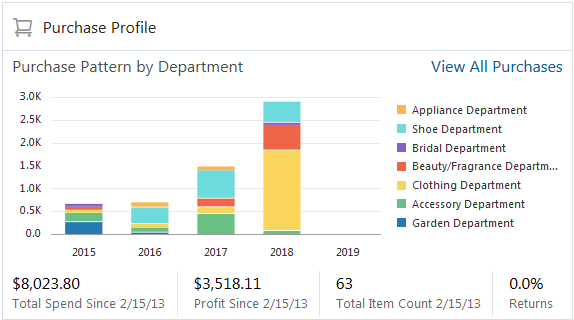
The Purchase Profile panel shows the purchase pattern of the customer. Each bar in the graph represents a year. The colored bands correspond to the revenue department* (*or other entity named by the client) in which the customer purchased products during that year, measured by the amount of spending. Each year in the graph displays the top five revenue departments (or other entities named by the client).
Figure 4-30 Customer Purchase Profile

-
Other revenue metrics include:
-
Total Spend - Shows how much the customer has spent since their first purchase to date.
-
Profit Since - Shows the total profit the store or chain has made since the customer's first purchase to date.
-
Total Item Count - Shows the total transaction (purchases minus returns) count for the lifetime of the customer. This includes all transactions, not just the ones represented in the five departments and five years displayed in the graph.
-
Returns - Shows the percentage of the amount of Returns to the amount of Total Spending.
-
-
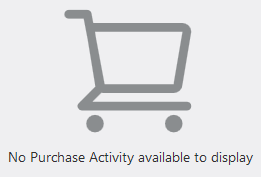
If there are no Purchase Profiles to show for the customer, an image with
No Purchase Activity available to displayappears:
Figure 4-31 No Purchase Activity Available Message

Viewing Purchase Pattern Details
Hover over a colored area in a graph to see detail information in a tool tip. This information includes:
-
Category – The category of the purchase, such as Clothing Department.
-
Category Spend – How much the customer spent on items in this category.
-
Classes – The name of the classes (or client-specific hierarchy level) within the selected category.
Viewing Purchase History
Click a colored area in a bar chart to go the Item Purchase History for all the items represented in that area.
You can also click the View All Purchases link to go to the Item Purchase History for all items.
See Item Purchase History for more information.