Segment Scorecards
The Segment Scorecard displays information about the Segment. You have the ability to periodically review the data on Segments. There are three types of Scorecards:
-
Stratified Scorecard
-
Unstratified Scorecard
-
Personal List Scorecard
Figure 7-75 Stratified Segment Scorecard

Note:
When no data is available a message appears informing you this Segment/Personal List does not contain any data.
Segment Scorecard Feature Bar
The Segment Scorecard Feature Bar contains the following information:
-
Title of the window.
-
Action Menu with the ability to Edit, View, or Duplicate the Segment/Personal List.
Figure 7-76 Action Menu Options

-
The following information displays below the Feature Bar.
-
Segment Type Icon
-
Segment Name
-
Segment ID
-
Scorecard Analysis
Scorecards display high level metrics on customers within the segment, based on summary data.
Stratified Segment Scorecard
The Stratified Segment Scorecard provides summary data metrics on customers within the each strata of the segment. Click one of the following choices:
-
Customer Analysis- The analysis of each Customer within the Segment based on Recency, Frequency, and Monitory Value.
-
Activity Analysis - The analysis of each Customer on the basis of strata level within the Segment using Recency, Frequency, and Monitory Value metric.
Customer Analysis Metrics
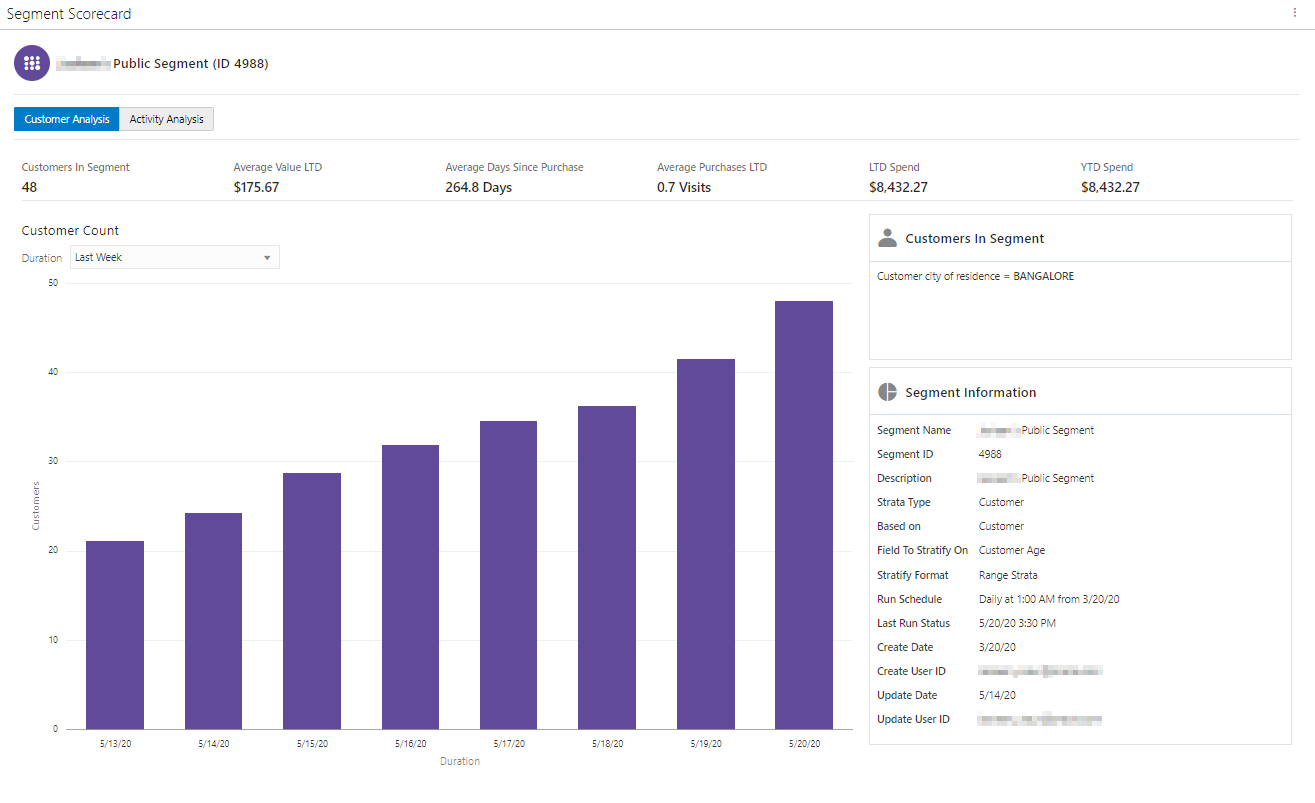
Figure 7-77 Segment Scorecard (Stratified) - Customer Analysis

-
The following metrics and their values display above a graph.
-
Customers in Segment
-
Average Value LTD
-
Average Days Since Purchase
-
Average Purchases LTD
-
LTD Spend
-
YTD Spend
-
-
Duration:
-
Last Week - Customer Trend for Last Week (7 days (Current date (-1)) is displayed.
-
Last Month (Default) - Customer Trend for Last Month (Current date (-1)) is displayed.
-
Last 6 Months - Customer Trend for Last 6 Months converted into weeks (Current date (-1)) is displayed.
-
Last Year - Customer Trend for Last 12 months (Current date (-1)) is displayed.
-
Lifetime to Date - Customer Trend for the last 5 years (Current date (-1)) is displayed.
-
Customer Count Graph
-
The bar graph will dynamically update the Customer Trend based on the value selected for the Duration.
-
The graph will represent a plot between the Customers Count on Y-axis and duration on X-axis for the Segment.
Segment Details Side Panel
-
Customers in Segment
-
The selected templates along with their field values separated by AND/OR logic is displayed below the title.
-
-
Segment Information
-
Segment Name
-
Segment ID
-
Description
-
Strata Type
-
Based On
-
Field to Stratify On
-
Strata Format
-
Run Schedule
-
Last Run Status
-
Create Date
-
Create User ID
-
Update Date
-
Update User ID
-
Activity Analysis Metrics
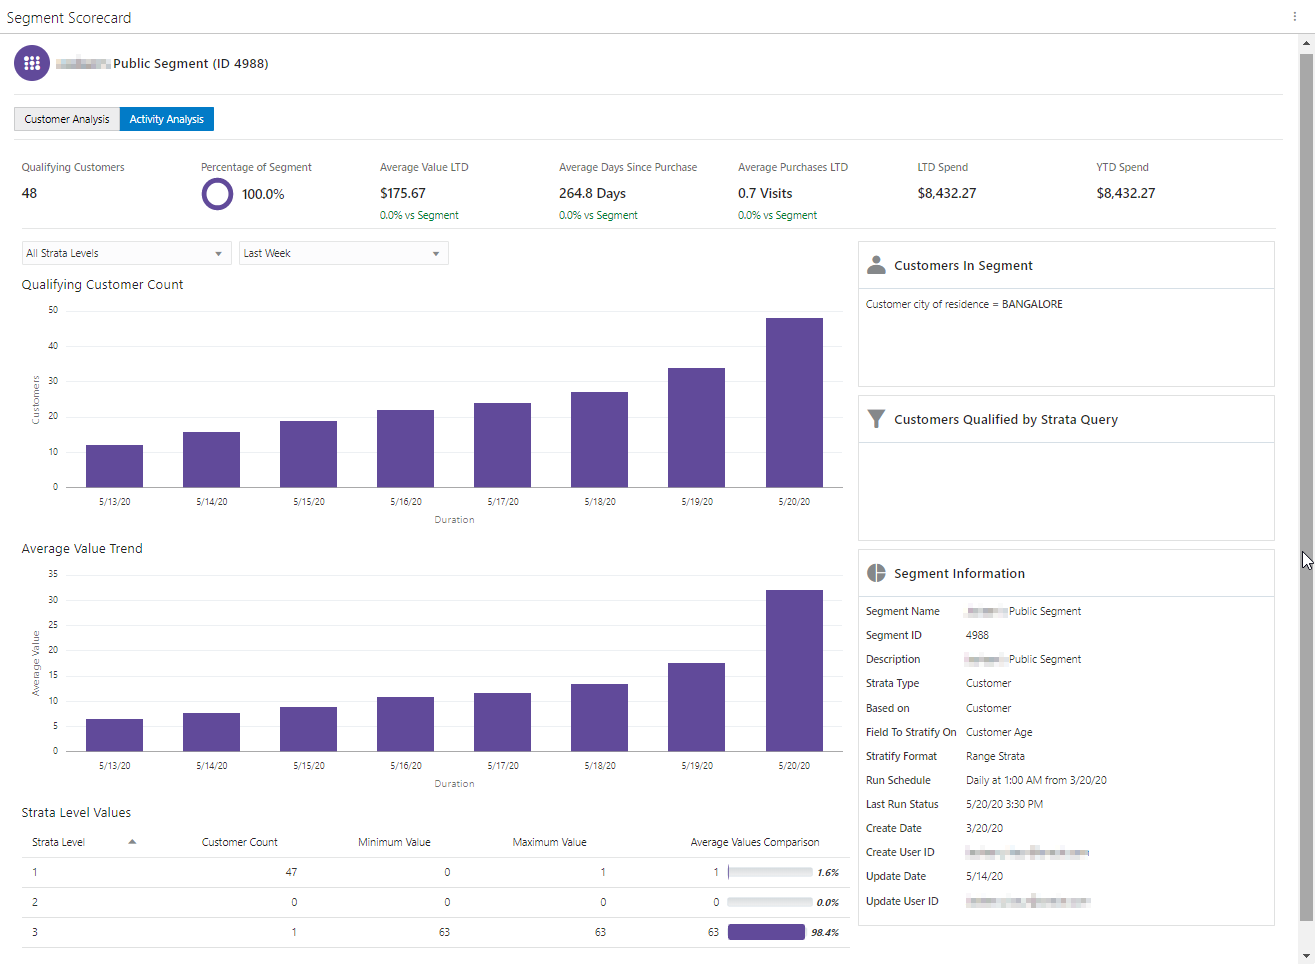
Figure 7-78 Segment Scorecard (Stratified) - Activity Analysis

-
The following metrics and their values display above a graph.
-
-
Qualifying Customers - The number of customers in the analysis.
-
Percentage of Segment - The Percentage of Customers in the Segment is represented by Doughnut chart.
-
Average Value LTD - The percentage increase will display in Green color and the percentage decrease will display in Red color.
-
Average Days Since Purchase -The percentage increase will display in Green color and the percentage decrease will display in Red color.
-
Average Purchases LTD - The percentage increase will display in Green color and the percentage decrease will display in Red color.
-
LTD Spend
-
YTD Spend
-
Qualifying Customer Count Graph
The Qualifying Customer Count graph dynamically updates based on the values selected for the number of Strata Levels and Duration. See Duration for duration details.
Average Value Trend Graph
The Average Value Trend graph dynamically updates based on the values selected for the number of Strata Levels and Duration. See Duration for duration details.
Strata Level Values
-
A list of all the Strata Levels defined for the segment display in the Strata Level selection menu. Once a selection is made (all strata levels or an individual strata) a table displays directly below the graph and includes the following values:
-
Strata Level - Number of the Strata Level
-
Customer Count - The number of Customers in the Strata.
-
Minimum Value - The smallest value for the field by a Customer in the Strata (will not display for Segment type = Unstratified Segment).
-
Maximum Value - The largest value for the field by a Customer in the Strata (will not display for Segment type = Unstratified Segment).
-
Average Value Comparison - The average value for the field among the Customers in the Strata.
-
-
Duration– Durations include:
-
Last Week - Customer Trend for Last Week (7 days (Current date (-1)) is displayed.
-
Last Month (Default) - Customer Trend for Last Month (Current date (-1)) is displayed.
-
Last 6 Months - Customer Trend for Last 6 Months converted into weeks (Current date (-1)) is displayed.
-
Last Year - Customer Trend for Last 12 months (Current date (-1)) is displayed.
-
Lifetime to Date - Customer Trend for the last 5 years (Current date (-1)) is displayed.
-
Segment Details Side Panel
-
Customers in Segment
-
The selected templates along with their field values separated by AND/OR logic is displayed below the title.
-
-
Customers Qualified by Strata Query - The Customers Qualified by Strata Query box reflects additional strata qualifiers selected when creating a stratified segment and the Strata Type is either Loyalty or Transaction.
-
Segment Information
-
Segment Name
-
Segment ID
-
Description
-
Strata Type
-
Based On
-
Field to Stratify On
-
Strata Format
-
Run Schedule
-
Last Run Status
-
Create Date
-
Create User ID
-
Update Date
-
Update User ID
-
Unstratified Segment Scorecard
The Unstratified Segment Scorecard provides summary data metrics on customers in the segment.
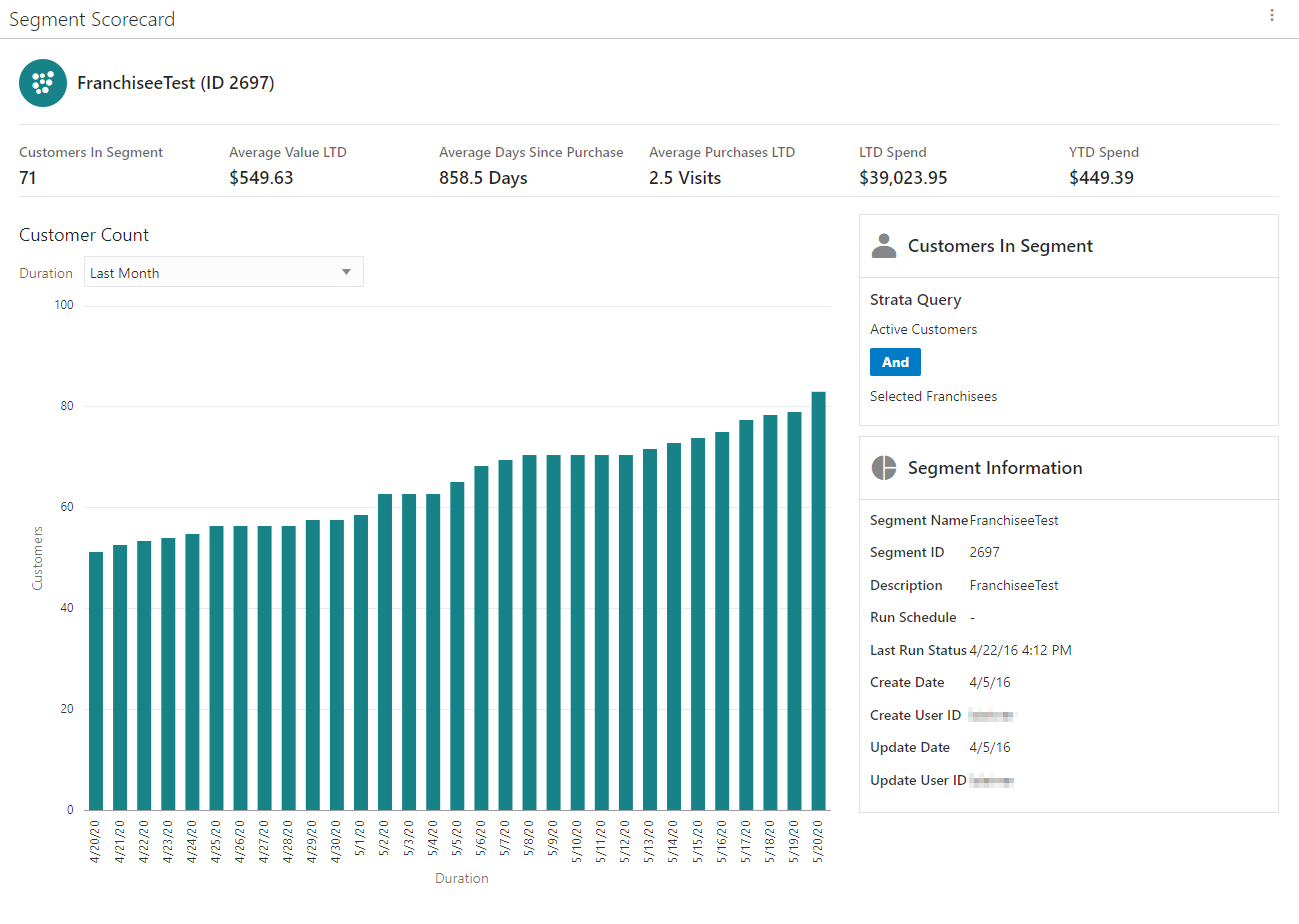
Figure 7-79 Segment Scorecard - Unstratified

-
The following metrics and their values display above a graph.
-
Customers in Segment
-
Average Value LTD
-
Average Days Since Purchase
-
Average Purchases LTD
-
LTD Spend
-
YTD Spend
-
-
Duration– Durations include:
-
Last Week - Customer Trend for Last Week (7 days (Current date (-1)) is displayed.
-
Last Month (Default) - Customer Trend for Last Month (Current date (-1)) is displayed.
-
Last 6 Months - Customer Trend for Last 6 Months converted into weeks (Current date (-1)) is displayed.
-
Last Year - Customer Trend for Last 12 months (Current date (-1)) is displayed.
-
Lifetime to Date - Customer Trend for the last 5 years (Current date (-1)) is displayed.
-
Customer Count Graph
-
The bar graph will dynamically update the Customer Trend based on the value selected for the Duration.
-
The graph represents a plot between the Customers Count on Y-axis and duration on X-axis for the Segment.
Segment Details Side Panel
-
Customers in Segment
-
The selected templates along with their field values separated by AND/OR logic is displayed below the title in View only mode.
-
-
Segment Information Panel
-
Segment Name
-
Segment ID
-
Description
-
Run Schedule
-
Last Run Status
-
Create Date
-
Create User ID
-
Update Date
-
Update User ID
-
Personal List Segment Scorecard
You have the ability to display the list of customers associated with the personal list, so that you can identify which customers are on the list and review their performance.
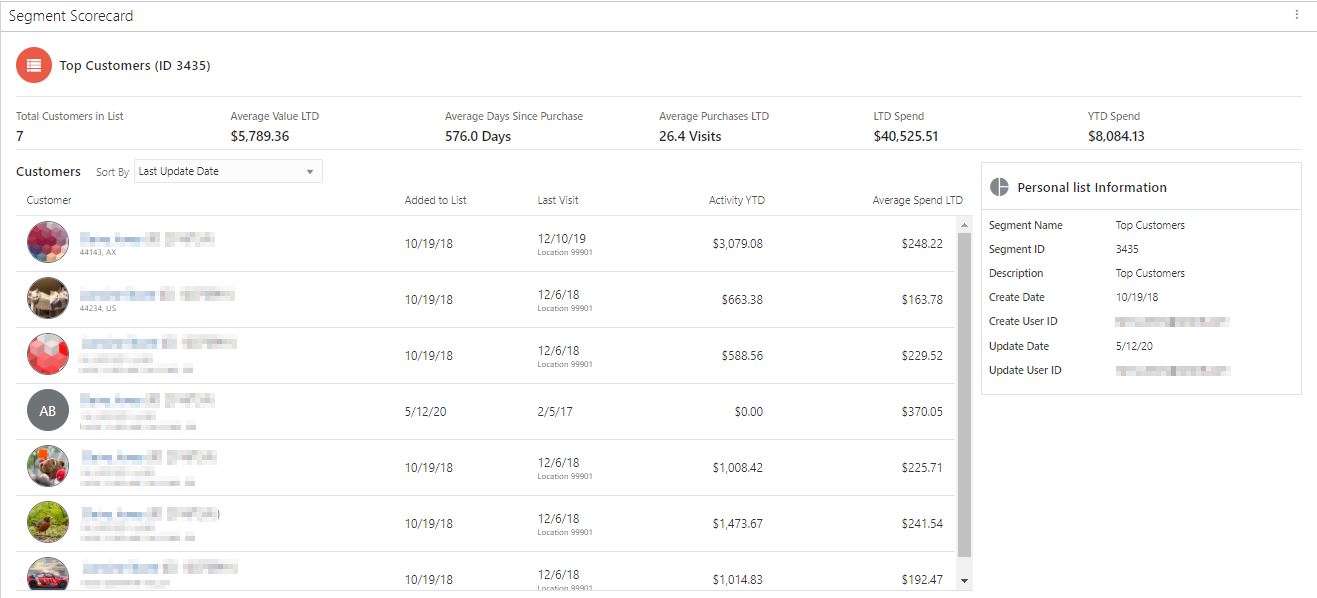
Figure 7-80 Personal List Scorecard

-
The following metrics and their values display above the list of results.
-
Total Customers in List
-
Average Value LTD
-
Average Days Since Purchase
-
Average Purchases LTD
-
LTD Spend
-
YTD Spend
-
-
Sort by - Options include:
-
Last Update Date (Customers are sorted by last updated date in descending order by default)
-
Average Spend LTD (Customers are sorted by Average Spend LTD in descending order)
-
Activity YTD (Customer are sorted by Activity YTD in descending order)
-
Last Visit (The Customer are sorted by last visit date in descending order)
-
Last Name (Customers are sorted by the Last Name in ascending order)
-
First Name (Customers are sorted by First Name in ascending order)
-
Address (Customers are sorted by Address in ascending order)
-
City (Customers are sorted by City in ascending order)
-
State (Customers are sorted by State in ascending order)
-
Added to List
-
Customer List
Note:
If more customers than can fit the window, a scroll bar displays. Select Show More... at the bottom of the page to retrieve more records.
-
The Customer List will dynamically update the results based on the value selected for the Sort by selection menu. The Customer List headers include:
-
Customer Name, ID, and Address
-
Added to List
-
Last Visit
-
Activity YTD
-
Average Spend LTD
-