28 Monitoring Oracle JCA Adapters
Monitoring Instances and Faults for an Inbound Adapter
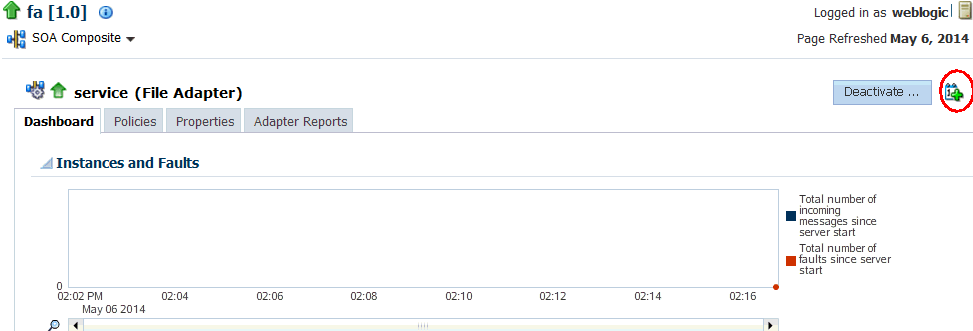
An invocation to a service from a composite may result in an error. This error is captured as a fault in the service. You can view the details of the instances and faults of the inbound adapter in the Instances and Faults section of the Dashboard page.
To monitor instances and faults for an inbound adapter:
-
Navigate to the SOA composite application by using either of the following options:
From the SOA Infrastructure Menu... From the SOA Folder in the Navigator... -
Click Home.
The SOA Infrastructure page is displayed.
-
Click the Deployed Composites tab.
The list of deployed composites is displayed.
-
In the Composite section, click a specific SOA composite application.
The SOA Composite home page is displayed.
-
Click the inbound adapter (service) from the Services and References section in the right panel.
The Service Home page is displayed.
-
Under soa-infra, click a specific SOA composite application.
The SOA Composite Home page is displayed.
-
Click the inbound adapter (Service) from the Services and References section in the right panel.
-
-
Monitor the instances and faults for an inbound adapter:
-
The Dashboard page is, by default, selected once you select the composite under soa-infra.
-
Select the Flow instance tab. Under that the Instances with Faults Section is displayed. You can view the instances and faults within the Instances and Faults section.
The details of the fault is displayed in a line chart in the Instances and Faults section, which you can search within to find recent faults. This line chart shows the total number of outgoing messages since the start of the server, and the total number of faults since the start of the server.
-
For more information about monitoring adapters, see Understanding Technology Adapters.
Monitoring Recent Faults and Rejected Messages for an Inbound Adapter
You can view the details of the recent faults and rejected messages of the inbound adapter under the Flow Instances tab of the Dashboard page.
To monitor the recent rejected messages for an inbound adapter:
-
Navigate to the SOA composite application by using either of the following options:
From the SOA Infrastructure Menu... From the SOA Folder in the Navigator... -
Click Home.
The SOA Infrastructure page is displayed.
-
Click the Deployed Composites tab.
The list of deployed composites is displayed.
-
In the Composite section, click a specific SOA composite application.
The SOA Composite home page is displayed.
-
Click the inbound adapter (Service) from the Services and References section in the right panel.
The Service Home page is displayed.
-
Under soa-infra, click a specific SOA composite application.
The SOA Composite home page is displayed.
-
Click the inbound adapter (service) from the Services and References section in the right panel.
The Service Home page is displayed.
-
-
Monitor the recent faults and rejected messages for an inbound adapter:
-
Click Dashboard.
The Dashboard page is displayed.
-
View the recent faults and rejected messages listed in Instances and Faults section within the Flow Instances tab.
A list of recently rejected faults and messages with details such as error message, fault time, and the business flow instance ID is displayed.
For more information about monitoring adapters, see Understanding Technology Adapters.
-
Monitoring Faults for an Inbound Adapter
You can view the details of the faults and rejected messages of an inbound adapter in the Flow Instances page.
To monitor the rejected messages for an inbound adapter:
-
Navigate to the SOA composite application by using either of the following options:
From the SOA Infrastructure Menu... From the SOA Folder in the Navigator... -
Click Home.
The SOA Infrastructure page is displayed.
-
Click the Deployed Composites tab.
The list of deployed composites is displayed.
-
In the Composite section, click a specific SOA composite application.
The SOA Composite Home page is displayed.
-
Under soa-infra, click a specific SOA composite application.
The SOA Composite Home page is displayed.
-
-
To monitor the faults and rejected messages for an inbound adapter:
-
View the recent faults and rejected messages listed in Instances and Faults section within the Flow Instances tab.
A list of faults and rejected messages with details such as error message, fault time, and business flow instance ID is displayed.
-
For more information about monitoring adapters, see Understanding Technology Adapters.
Searching for Rejected Messages for an Inbound Adapter
Use the Search feature to search for faults and rejected messages for an inbound adapter.
To search for faults and rejected messages for an inbound adapter:
-
Navigate to the SOA composite application by using either of the following options:
From the SOA Infrastructure Menu... From the SOA Folder in the Navigator... -
Click Home.
The SOA Infrastructure page is displayed.
-
Click the Deployed Composites tab.
The list of deployed composite applications is displayed.
-
In the Composite section, click a specific SOA composite application.
The SOA Composite Home page is displayed.
-
Under soa-infra, click a specific SOA composite application.
The SOA Composite Home page is displayed.
-
-
Select the Flow instance tab to obtain the Instances with Faults section.
-
Enter any or all of the following search options:
-
Instances within a Time Range
Enter any part of the error message text.
-
Time
Enter the ID of the fault.
-
Composite
Select Initiating or Participating from the toggle.
-
State
Select Active, which can be one of All Active, Recovery, Running, Suspended, or Inactive, which can be one of All Inactive, Completed, Failed or Aborted
-
Fault
Select a type from the list of faults available. These include: All Faults, Recovery Required, Nonrecoverable, Recovered, System Auto Retries
-
You can also choose to search for only Recent Instances, Instances with Faults, Recoverable Instances.
-
-
Click Search to start the search operation.
The fault or rejected message matching the criteria you specified is displayed.
-
Click Reset to reset the search criteria.
For more information about configuring adapters, see Understanding Technology Adapters.
Deleting Rejected Messages for an Inbound Adapter
You can directly delete rejected messages from the database by specifying a search criteria.
To delete rejected messages for an inbound adapter:
-
Navigate to the SOA composite application by using either of the following options:
From the SOA Infrastructure Menu... From the SOA Folder in the Navigator... -
Click Home.
The SOA Infrastructure page is displayed.
-
Click the Deployed Composites tab.
The list of deployed composite applications is displayed.
-
In the Composite section, click a specific SOA composite application.
The SOA Composite home page is displayed.
-
Under soa-infra, click a specific SOA composite application.
The SOA Composite home page is displayed.
-
-
Select the Flow instance tab to obtain the Instances with Faults section.
-
Click the Delete Selected Flow Instances icon
The Delete Selected Flow Instances dialog is displayed.
-
Click Delete.
To delete a fault, you must delete the associated business flow instance from the Instances page.
For more information about configuring adapters, see Understanding Technology Adapters.
Monitoring Properties for an Inbound Adapter
You can view the details of the properties of an inbound adapter in the Properties page.
To monitor the properties for an inbound adapter:
-
Navigate to the SOA composite application by using either of the following options:
From the SOA Infrastructure Menu... From the SOA Folder in the Navigator... -
Click Home.
The SOA Infrastructure page is displayed.
-
Click the Deployed Composites tab.
The list of deployed composites is displayed.
-
In the Composite section, click a specific SOA composite application.
The SOA Composite home page is displayed.
-
Click the inbound adapter (service) from the Services and References section in the right panel.
The Service Home page is displayed.
-
Under soa-infra, click a specific SOA composite application.
The SOA Composite home page is displayed.
-
Click the inbound adapter (service) from the Services and References section in the right panel.
The Service Home page is displayed.
-
-
Monitor the properties for an inbound adapter:
-
Click Properties.
The Properties page is displayed for that adapter.
A list of properties with details such as name and value is displayed.
-
Note:
For any adapter that has an inbound asynchronous request-reply scenario (the Get Message operation preceding the Send Reply operation), only details about the activation specification are displayed; details about the interaction specification are not displayed.
For more information about monitoring adapters, see Understanding Technology Adapters.
Monitoring Instances and Faults for an Outbound Adapter
An invocation to a reference from a composite may result in an error. This error is captured as a fault in the reference. The details of the instances and faults of the outbound adapter can be viewed in the Instances and Faults section of the Dashboard page.
To monitor instances and faults for an outbound adapter:
-
Navigate to the SOA composite application by using either of the following options:
From the SOA Infrastructure Menu... From the SOA Folder in the Navigator... -
Click Home.
The SOA Infrastructure page is displayed.
-
Click the Deployed Composites tab.
The list of deployed composites is displayed.
-
In the Composite section, click a specific SOA composite application.
The SOA Composite home page is displayed.
-
Click the outbound adapter (reference) from the Services and References section in the right panel.
The Service Home page is displayed.
-
Under soa-infra, click a specific SOA composite application.
The SOA Composite home page is displayed.
-
Click the outbound adapter (reference) from the Services and References section in the right panel.
The Service Home page is displayed.
-
-
Monitor the instances and faults for an outbound adapter:
-
Click Dashboard.
The Dashboard page is displayed.
-
View the instances and faults listed in the Instances and Faults section, after clicking on the Flow Instances tab.
The details of the fault is displayed in a line chart in the Instances and Faults section. This line chart shows the total number of outgoing messages since the start of the server, and the total number of faults since the start of the server.
-
Select Table View to see an expanded table view listing to see total number of messages since server start or total number of faults since server start, which you can sort by ascending, or descending order, or you can sort by more advanced criteria by choosing advanced.
-
For more information about monitoring adapters, see Understanding Technology Adapters.
Monitoring Faults for an Outbound Adapter
The details of the instances and faults of the outbound adapter can be viewed in the Faults page.
To monitor faults for an outbound adapter:
-
Navigate to the SOA composite application by using either of the following options:
From the SOA Infrastructure Menu... From the SOA Folder in the Navigator... -
Click Home.
The SOA Infrastructure page is displayed.
-
Click the Deployed Composites tab.
The list of deployed composites is displayed.
-
In the Composite section, click a specific SOA composite application.
The SOA Composite Home page is displayed.
-
Under soa-infra, click a specific SOA composite application.
The SOA Composite Home page is displayed.
-
-
To monitor the faults for an outbound adapter:
-
Select the Flow instance tab to obtain the Instances with Faults section.
-
Select Table View to see a listing of faults, total number of incoming messages since server start and total number of faults., and to sort the displayed data according to your preference.
-
For more information about monitoring adapters, see Understanding Technology Adapters.
Searching for Faults for an Outbound Adapter
Use the Search feature to search for faults for an outbound adapter.
To search for faults for an outbound adapter:
-
Navigate to the SOA composite application by using either of the following options:
From the SOA Infrastructure Menu... From the SOA Folder in the Navigator... -
Click Home.
The SOA Infrastructure page is displayed.
-
Click the Deployed Composites tab.
The list of deployed composite applications is displayed.
-
In the Composite section, click a specific SOA composite application.
The SOA Composite Home page is displayed.
-
Under soa-infra, click a specific SOA composite application.
The SOA Composite Home page is displayed.
-
-
Select the Flow instance tab to obtain the Instances with Faults section.
-
Click the Search icon at the right to execute any saved Searches.
-
In the Search Options section, enter any or all of the following search criteria:
-
Select the Reset icon to reset the search criteria.
-
Select the Disk icon to save the custom search.
-
Select the Bookmark icon to generate a bookmarkable link.
-
Select the Funnel icon on the right to customize (that is, add or remove) filters.
-
On the Add/Remove Filters link t you can set Filters by you can add or remove Filters by Time, Composite, Resequencer, Flow Instance, State, Fault, or User.
-
Using Search Options, you can set Recent Instances, Instances with Faults, Recoverable Instances, All Saved Searches.
-
You can either select Customize Time Period, or Last number of hours, minutes, days or weeks.
-
Choose Participating or a Composite.
-
Choose State, which can be All Active, Recovery, Suspended, Running.
-
Chose Fault, which can be any one of All Faults, Recovery Required, Nonrecoverable, Recovered, System Auto Retries.
-
-
Click Search to start the search operation.
The fault matching the criteria you specified is displayed.
For more information about configuring adapters, see Understanding Technology Adapters.
Monitoring Properties for an Outbound Adapter
The details of the properties of the outbound adapter can be viewed on the Properties page.
To monitor properties for an outbound adapter:
-
Navigate to the SOA composite application by using either of the following options:
From the SOA Infrastructure Menu... From the SOA Folder in the Navigator... -
Click Home.
The SOA Infrastructure page is displayed.
-
Click the Deployed Composites tab.
The list of deployed composites is displayed.
-
In the Composite section, click a specific SOA composite application.
The SOA Composite home page is displayed.
-
Click the outbound adapter (reference) from the Services and References section in the right panel.
The Service Home page is displayed.
-
Under soa-infra, click a specific SOA composite application.
The SOA Composite home page is displayed.
-
Click the outbound adapter (reference) from the Services and References section in the right panel.
The Service Home page is displayed.
-
-
Monitor the properties for an outbound adapter:
-
Click the Properties tab.
The Properties page is displayed.
-
Click View.
A list of properties with details such as name and value is displayed.
-
Note:
Where an adapter has an outbound asynchronous request-reply scenario (the Send Message operation preceding the Get Response operation), only details about the interaction specification are displayed, and details about the activation specification are not displayed.
For more information about monitoring adapters, see Understanding Technology Adapters.
Monitoring Adapter Logs
Oracle Fusion Middleware components generate log files containing messages that record all types of events, including startup and shutdown information, errors, warning messages, access information on HTTP requests, and additional information. There is only one logger for all Oracle JCA Adapters, and the logger is called oracle.soa.adapter.
To monitor the File adapter logs:
For information about configuring logs, see Configuring Log Files. For information about diagnostics related to logs, see Diagnosing Problems with SOA Composite Applications.
Adapter Configuration Reports
Oracle Adapter Configuration reports provide information on how you have configured Adapters. They provide diagnostics information in addition to Snapshot reports and Monitoring reports. Without this the support, one has to go through multiple consoles and logs for diagnosis. There are many more Adapter properties than those reported on in the diagnostic reports; however, the reports provide information from the most relevant properties.
The configuration report provides information on the service endpoints; each of these reports correlate and provide you with information that would otherwise require you to do a large amount of moving between different reports to find information related to Adapter configuration.
Adapter Configuration reports capture:
-
Connection Factory properties
-
Service Definition Properties (Activation Properties and other specs related to a service endpoint).
-
Service Tuning Properties - Service endpoint properties used to tune the service to alter performance items such as throughput and throttling.
-
Reference Definition Properties (Interaction Properties and other types of specs involved in Reference endpoint).
-
Reference Tuning Properties - Reference endpoint properties used to tune the service to alter performance factor such as throughput and throttling.
The Reports do not provide information on Adapter-specific properties that are not part of Connection Factory properties. For example, the reports do not provide information on LDAP RootDSE properties.
Enabling Display of Adapter Reports
You can enable the following Adapter reports to display in Oracle Enterprise Manager Fusion Middleware Control:
You can enable reports by checking the box at the top of the Monitoring Reports page. Another way to enable reports to add corresponding property on the Properties tab.
Monitoring Report
Within a Monitoring report, showing real-time monitoring statistics, the activation spec provides configuration-related information, including:
-
EIS connection configurations, displayed as connection factory properties.
-
Resources that are being accessed. These include Managed Connections and the Most Recent Timestamp for such connections.
-
Additional tuning information, such as Currently Free Connections and Maximum Pool Size for Connections.
Figure 28-1 shows the appearance of the Monitoring report in the context of the Diagnosability and Snapshot reports. This report shows a information related to a service endpoint.
Figure 28-1 Monitoring Report Showing Statistics for a Service Endpoint

Description of "Figure 28-1 Monitoring Report Showing Statistics for a Service Endpoint"
See Figure 28-1 for a description of the elements in the Monitoring Report.
Table 28-1 Adapter Monitoring Report Elements
| Element | Description |
|---|---|
|
Server Name |
The name of the server where the endpoint is deployed. |
|
EIS Connection Status |
Indicates if the EIS is connected to the Endpoint. You can click status icon to obtain stack trace if status is Not connected. |
|
Managed Connections |
Connection pool statistics for the managed connections for this Adapter to Enterprise Information System (EIS) systems. |
|
Currently Free |
The pool size of this Connector connection pool. |
|
Average Number Used |
The running average usage of created connections that are active in the Connector Pool since the pool was last shrunk. |
|
Currently Free |
The current total free connections. |
|
Maximum Pool Size |
The maximum capacity configured for this Connector connection pool. |
|
Most Recent Time Stamp |
The most recent time stamp for last message publication and last service activation. |
|
Last Message Publication |
Last message published to the fabric for a service endpoint; last message published to the EIS for a reference endpoint. |
|
Last Service Activation |
Last time the service endpoint was activated. Only for a service endpoint. |
|
Last Reference Interaction |
Last time the reference endpoint was activated. Only for a reference endpoint. |
Configuration Reports
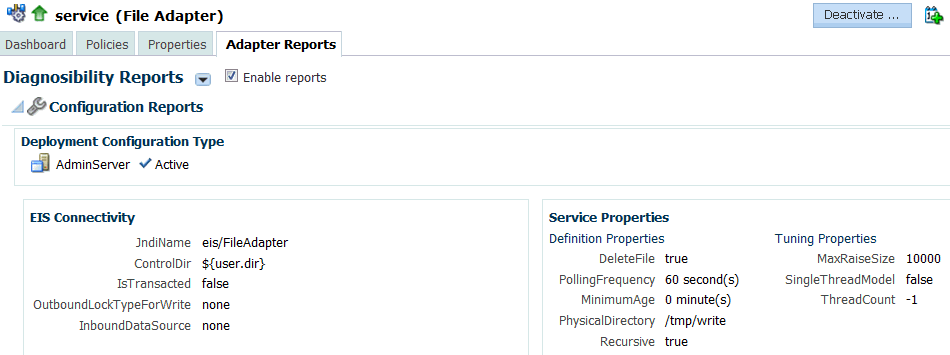
The Configuration report within the Diagnosability Report from the Oracle Enterprise Manager Fusion Middleware Control dashboard shows a summary of connection factory, binding and activation properties for a specific service endpoint.
Figure 28-2 shows an Adapter Configuration Report for a Service Endpoint, showing Deployment Configuration Type, and information about EIS Connectivity and Service Properties, including definition properties and Tuning Properties, in this case properties that are specific to a File Adapter.
See Table 28-2 for a description of the elements in the Adapter Configuration Report.
Note that you need to select Related Links (at the top right of the page) to initiate the process of configuring a connection factory within the WebLogic Server Console.
Table 28-2 Adapter Configuration Reports Elements
| Element | Description |
|---|---|
|
Deployment Configuration Type |
Indicates if the endpoint is part of an active-active or active-passive configuration. This is only displayed for a service endpoint. |
|
EIS Connectivity |
Provides information about connection factory properties related to this endpoint and its connection to the Enterprise Information System. |
|
Service Properties |
Lists Definition Properties, used to define services specific to this endpoint, and Tuning Properties, used to tune services specific to this endpoint. For Reference Endpoints, there are Reference Properties which include Definition Properties and Tuning Properties. See the User's Guide to Technology Adapters appendix for the complete list and definitions of the properties. |
Snapshot Reports
The Snapshot Reports section of the Service or Reference Adapter Reports Page provides connection downtime and message statistics over a specified period.
Snapshot reports aggregate historical data over a selected period of time.
The default for snapshot data persistence is 15 minutes, which is the period of time collection over which the captured data persists when Write to database is checked. You can configure the snapshot interval from the snapshotInterval property in the Properties tab. Because the default value of some properties on the Properties tab is not shown explicitly, you might need to add snapshotInterval property from the properties page and then modify it as you require. You can select Write to Database on a Report Screen to have the data persisted.
Similarly, you can add or modify enableSnapshots (enables Write to Database) and select the Enables Reports checkbox (enables Reports).
Note that you must understand each Snapshot report in the context of the functioning of the specific adapter; for example, for the Database Adapter, the payload size that is reported and displayed is the size of XML produced by the Adapter, never the size of XML consumed by the Adapter.
Where an adapter has no output, the size is reported as 0.
For the same service endpoint, you can correlate information from the Snapshot report and the Monitoring Report.
Figure 28-3 shows an example Snapshot Report, with the Message Statistics tab selected. The Report shows:
-
Data will be retrieved over the last 24 hours
-
The name of the server for which information is being collected
-
Average Message Size, in bytes
-
Maximum Message Size, in bytes
-
Minimum Message Size, in bytes
-
Total Message Size, in bytes
-
Number of Messages
-
Data Location, specifying Persisted or In-Memory, as indicated by an icon and tooltip
-
Write to Database-enables data persistence. By default, the data is not persisted. Note that when enabled, persistence is enabled concurrently for both EIS Connection statistics and Message statistics at once. Once you enable persistence, the value for writes to the database is displayed (for example, "every 15 minutes".)
Figure 28-3 Snapshot Report, with Message Statistics Tab Selected

Description of "Figure 28-3 Snapshot Report, with Message Statistics Tab Selected"
Figure 28-4 shows an example Snapshot Report, with EIS Connection Downtime, or the down shown. The Report shows:
-
Server Name
-
The Start EIS Downtime-when the connection downtime began
-
The End EIS Downtime-when the connection downtime ended
-
Error Summary-A summary of the errors that might be related to the downtime.
-
Total EIS Connection Downtime.
-
Data Location, specifying Persisted or In-Memory, as indicated by an icon and tooltip
-
Show XML button, which when clicked on provides XML data for the information that is displayed.
Figure 28-4 Snapshot Report with EIS Connection Downtime Tab Selected

Description of "Figure 28-4 Snapshot Report with EIS Connection Downtime Tab Selected "
Snapshot Reporting Persistence and Intervals
The snapshot persistence period can provide historical data over the period the data is persisted; this period is different than the global refresh period for the Oracle Enterprise Manager Fusion Middleware Control.
You must also distinguish the Snapshot Interval (default is 15 minutes) versus the Retrieve Data period, which is defaulted to one day.
Persisted and In-memory data is shown per query criteria (that is, EIS connection downtime falls within the time range used for searching or message publication time is within the time range used for searching).
The persistence setting provides a way to guard saved data from crashes and downtime. However, there is a performance cost to retaining saved data.
A Data Location column in the reports contains either or both of two icons which signify the place of origin of the data in the reports in the appropriate row: either from persistent data or from in-memory data.
Also note that data is not persisted in the following circumstances.
For non-persisted (in-memory) data, when the following occur:
-
Write to database is unchecked
-
The adapter's composite application is shutdown or retired
-
Composite is un-deployed
-
The Adapter endpoint is de-activated (for service endpoints)
-
The SOA server is bounced
-
Auto purge occurred
For persisted data, data is not persisted when the following occur:
-
Auto purge occurred
You can search and retrieve past data. Therefore, the Retrieve Data search control is always available for data that persists. The search feature is specific to Enterprise Information System (EIS) Connection statistics and is distinct from Message statistics.
Table 28-3 provides information about the different elements found in the Snapshot Adapter Reports and their meaning.
Table 28-3 Snapshot Adapter Report Elements
| Element | Description |
|---|---|
|
EIS Connection Downtime |
(Only shown for the service downtime.) |
|
Select a Time Range |
The time range filter delimits the statistics displayed in the snapshot reports to a specified number of minutes, hours, days, or weeks. |
|
Show XML |
Shows the EIS connection downtime in an XML format. |
|
Server Name |
The name of the server connected to this Adapter for which messages are being displayed. |
|
End EIS Connection Downtime |
Time at which the EIS connection is restored. |
|
Start EIS Downtime |
The time at which the EIS connection is lost. |
|
Error Summary |
Select Error Summary to provide stack trace. |
|
Message statistics |
|
|
Server Name |
The name of the server where this endpoint is displayed. |
|
Average Message Size |
Average message size processed for the filtered snapshot interval. |
|
Maximum Message Size |
Maximum message size processed for the filtered snapshot interval. |
|
Minimum Message Size |
Minimum message size processed for the filtered snapshot interval. |
|
Total Message Size (Bytes) |
Sum total of all the messages processed for the filtered snapshot interval. |
|
Number of Messages |
Number of messages processed for the filtered snapshot interval. |
|
Data Location |
Specifies Persisted or In-Memory, as indicated by an icon and tooltip. |
|
Write to Database |
Select this checkbox to enable persistence. The value (for example, every 15 minutes) shows how often that write to the database happens, when enabled. By default the check box is not selected. Persistence is enabled for both EIS Connection starts and Message statistics at the same time. The screen indicates the following: “Select to persist the data. Persisted data remains available in case of downtimes or crashes, or if you disable the reports; but it impacts performance. Persistence operations involve a snapshot scheduler and repetitive I/O (disk read and write) operations. Persistent operations are different from in-memory operations because I/O operations from memory are faster than Database operations. |
Configuration Report Categories and Adapter Properties Reported
The following tables show, for each Adapter type, the configuration report category, the available property name, and a description of each property. Although adapter configuration properties can be set at service/reference Mbean and Adapter binding Mbean, the Adapter configuration report shows only properties from the Adapter binding Mbean.
Table 28-4 MSMQ Adapter Connection Factory Properties
| Property Name | Description |
|---|---|
|
|
MQ Series Queue Manager Name. |
|
|
Port on which the Queue Manager is listening. |
|
|
Host on which the Queue Manager is running. |
|
|
MQ Series Server Connection Channel name. |
|
|
The URL to the MQ Series CCDT file. |
|
|
Flag that enables participation in JTA transaction. |
|
|
Flag that enables SSL. |
Table 28-5 MSMQ Adapter Service Definition Properties
| Property Name | Description |
|---|---|
|
|
Queue on which the MQSeries Adapter is polling. |
|
|
The configured Backout Queue Name (if any). |
|
|
Message selector to filter inbound messages. |
Table 28-6 MSMQ Adapter Service Tuning Properties
| Property Name | Description |
|---|---|
|
|
JCA retry count before the message is rejected. |
|
|
Time interval between the JCA retries. |
|
|
Specifies the size of the payload that the adapter can process. |
|
|
Number of inbound polling threads to dequeue messages. |
Table 28-7 MSMQ Adapter Reference Definition Properties
| Property Name | Description |
|---|---|
|
|
Queue to which messages are published. |
|
|
Queue from which messages are dequeued. |
|
|
Specfies whether large messages should be segmented. |
Table 28-8 MSMQ Adapter Reference Tuning Properties
| Property Name | Description |
|---|---|
|
|
JCA retry count before the message is rejected. |
|
|
Time interval between the JCA retries. |
|
|
Specifies the size of the payload that the adapter can process. |
Table 28-9 File Adapter Connection Factory Properties
| Property Name | Description |
|---|---|
|
|
The directory used by the adapter for storing bookkeeping information. |
|
|
Specifies to the data source name to enable high availability on the inbound adapter. |
|
|
Set to |
|
|
Set to |
Table 28-10 File Adapter Service Definition Properties
| Property Name | Description |
|---|---|
|
|
Directory to be polled by the File Adapter. |
|
|
If set to |
|
|
If set to |
|
|
Specifies (in seconds) how often the File/FTP Adapter wakes up in order to look for files in the inbound directory. |
|
|
Specifies the time interval after which a file should be picked up for processing. For example, this enables a large file to be completely copied into the directory before it is retrieved for processing. The age is determined by the last modified time. If a file is detected in the input directory and its modification time is less than 5 minutes older than the current time, the file is not retrieved because it is still potentially being written to. |
|
|
Indicates that a file contains multiple messages and specifies how many messages should be processed at one time. For example, if a file has 11 records and this parameter is set to 2, then the file will be processed 2 records at a time and the final record will be processed in the 6th iteration. |
|
|
This parameter is used to override the encoding specified in the NXSD schema for the inbound File/FTP Adapter. |
Table 28-11 File Adapter Service Tuning Properties
| Property Name | Description |
|---|---|
|
|
If this parameter is available, the adapter creates its own processor threads rather than depending on the global thread pool processor threads (by default 4 of them). In other words, this parameter partitions the in-memory queue and each composite app gets its own in-memory queue. If the |
|
|
If the value is |
|
|
Specifies the maximum number of files that the File/FTP Adapter will submit for processing in each polling cycle. For example, if the inbound directory has 1000 files and this parameter is set to |
Table 28-12 File Adapter Reference Definition Properties
| Property Name | Description |
|---|---|
|
|
Directory path for outbound file write. |
|
|
Used for outbound batching. The outgoing file is created when the number of messages condition is met. The parameter is of type |
|
|
Specifies the naming convention for the outbound write operation file. |
|
|
If set to |
|
|
Specifies the chunk size for the chunked interaction operation. |
Table 28-13 File Adapter Reference Tuning Properties
| Property Name | Description |
|---|---|
|
|
Specifies the maximum number of translation activities that can be allowed to execute in parallel for a particular outbound scenario. The translation step during the outbound operation is CPU intensive and hence needs to be guarded as it might cause other applications/threads to starve. The maximum is |
|
|
If set to |
|
|
Applicable only if |
|
|
If set to |
Table 28-14 FTP Adapter Specific Connection Factory Properties (Properties in addition to those for file adapter)
| Property Name | Description |
|---|---|
|
|
FTP server host name |
|
|
FTP server port |
|
|
FTP server user name |
|
|
FTP server password |
|
|
Specifies the default date format value. On the FTP server, this is the value for files that are older. The default value for this parameter is |
|
|
Specifies the recent date format value. On the FTP server, this is the value for files that were recently created. |
|
|
Directs the FTP Adapter how it should parse the response from the |
|
|
Indicates if the FTP Adapter uses the active/passive mode to connect to FTP server. |
|
|
Set to |
|
|
Set to |
Table 28-15 FTP Adapter Specific Service Definition Properties (Properties in addition to those for file adapter)
| Property Name | Description |
|---|---|
|
|
Used by the FTP Adapter to address timezone issues, typically to convert the time difference between the FTP server and the system on which the FTP Adapter is running to milliseconds. |
|
|
Set to |
Table 28-16 FTP Adapter Specific Service Tuning Properties (Properties in addition to those for file adapter)
| Property Name | Description |
|---|---|
|
|
Timeout on the control socket in milliseconds. |
Table 28-17 Socket Adapter Connection Factory Properties
| Property Name | Description |
|---|---|
|
|
Host on which ServerSocket is running. |
|
|
Port on which ServerSocket is listening. |
|
|
Queue length for incoming connection. |
|
|
Flag that enables SSL. |
|
|
Flag that enables pooling of connections. |
Table 28-18 Socket Adapter Service Definition Properties
| Property Name | Description |
|---|---|
|
|
Host on which ServerSocket is running. |
|
|
Port on which ServerSocket is listening. |
|
|
Translation mode of Adapter. |
|
|
Encoding of data. |
|
|
Byte order of the data. |
Table 28-19 Socket Adapter Service Tuning Properties
| Property Name | Description |
|---|---|
|
|
Number of threads processing messages in inbound (only in NIO mode). |
Table 28-20 Socket Adapter Reference Definition Properties
| Property Name | Description |
|---|---|
|
|
Host on which ServerSocket is running. |
|
|
Port on which ServerSocket is listening. |
|
|
Translation mode of adapter. |
|
|
Encoding of data. |
|
|
Byte order of the data. |
Table 28-21 UMS Adapter Connection Factory Properties
| Property Name | Description |
|---|---|
|
|
Set to |
Table 28-22 UMS AdapterService Definition Properties
| Property Name | Description |
|---|---|
|
|
Specifies the message channel to receive/send messages. |
|
|
Address from which to receive incoming messages. One or more comma-separated device addresses, such as email addresses or mobile phone numbers. |
|
|
Specifies how the adapter will receive messages from UMS. Set to |
|
|
Name of the Java class that defines custom logic for a message filtering or any other check, after message is accepted from UMS. It is a concrete implementation of |
|
|
Specifies one or more message filters. A single filter would comprise of a Java Pattern String to match against incoming message's content/metadata, along with the metadata field type and the action ( |
Table 28-23 UMS Adapter Service Tuning Properties
| Property Name | Description |
|---|---|
|
|
The number of inbound poller or listener threads. |
|
|
Polling interval in seconds for poller consume mode. |
Table 28-24 UMS Adapter Reference Definition Properties
| Property Name | Description |
|---|---|
|
|
The message channel through which to send messages. |
Table 28-25 UMS Adapter Outgoing Message Properties
| Property Name | Description |
|---|---|
|
|
Set to |
Table 28-26 LDAP Adapter Connection Factory Properties
| Property Name | Description |
|---|---|
|
|
JNDI string location pointing to a valid XA data source. |
|
|
Host name of the directory server. |
|
|
Port where the LDAP service is running. |
|
|
DN of the entry that will be used to bind to the LDAP service. |
|
|
Client-side timeout defined at the connection level. If the response is not received by the DS in the timeout period, the operation will be abandoned and an exception will be raised. |
|
|
Use start TLS extended operation to secure communication with a directory server over a non-encrypted channel. Port in this case is listening for clear-text LDAP connections. |
|
|
Indicates that the LDAP adapter should use SSL to secure communication with the directory server. The server must be configured to listen in SSL mode and the value for the port argument must be one where the server is listening for SSL based connections. |
Table 28-27 LDAP Adapter Service Definition Properties
| Property Name | Description |
|---|---|
|
|
Specifies how notifications are polled and published. Based on the Timestamp of the changeLog and if changelog, which changeLog mechanism. |
|
|
If set to |
|
|
Valid DN under which events should be reported. |
|
|
Scope of event source under the configured base DN. |
|
|
Advanced filter condition. Only events that satisfy the given filter condition will be published by the Adapter. Value should be a valid string representation of LDAP filter. |
|
|
When set to |
|
|
A list of all the attributes to return as part of the event. |
|
|
String |
Table 28-28 LDAP Adapter Service Tuning Properties
| Property Name | Description |
|---|---|
|
|
Polling interval before conducting a subsequent search for new events. |
|
|
Integer value representing the byte count threshold limit of the message to be published. |
|
|
Maximum number of entries returned as part of a search operation. This can be configured on the DS side as well. The lower of the two values will take effect. |
|
|
Maximum time the server should wait before returning the results. |
|
|
Maximum number of events that should be published in a page. |
Table 28-29 LDAP Adapter Reference Definition Properties
| Property Name | Description |
|---|---|
|
|
The Adapter constructs the appropriate control objects from this interaction spec property and passes them along with the request message. |
Table 28-30 LDAP Adapter Reference Tuning Properties
| Property Name | Description |
|---|---|
|
|
Maximum number of entries returned as part of a search operation. This value can be configured on the Directory Server side as well. If so, the lower of the two values takes effect. |
|
|
Maximum time in seconds the server should wait before returning the results. |
|
|
Referral chase strategy. |
|
|
Maximum number of permissible hops while chasing referrals. |
|
|
Behavior for handling alias entries while processing the search. |
|
|
DSML contains a batch request. This batch request can potentially contain millions of LDAP operation requests. This property is used to control the maximum number of permissible operation requests that can be passed to the LDAP adapter through a single DSML batch request. |
Table 28-31 DB Adapter Service Definition Properties
| Property Name | Description |
|---|---|
|
|
Indicates how to poll for records and what to do with them after they have been read so they are only processed once. |
|
|
A name generated from the root table name. |
Table 28-32 DB Adapter Service Tuning Properties
| Property Name | Description |
|---|---|
|
|
Specifies how often to poll for new records. |
|
|
Specifies how many records to fetch at a time and process in a single transaction (not per polling interval). |
|
|
Specifies how many top-level records to bundle into a single XML document and hence a single process instance. |
|
|
Specifies how many threads concurrently poll for and process records. |
Table 28-33 DB Adapter Reference Definition Properties
| Property Name | Description |
|---|---|
|
|
The schema to which the stored procedure belongs. |
|
|
The package to which the stored procedure belongs. |
|
|
The name of the stored procedure being executed. |
|
|
The SQL to execute |
|
|
A name generated from the root table name. |
|
|
The name of the EclipseLink query being executed |
|
|
If |
|
|
Indicates |
Table 28-34 JMS Adapter Connection Factory Properties
| Property Name | Description |
|---|---|
|
|
JMS provider connection factory. |
|
|
Enables parameters that establish context for remote lookup. |
|
|
Flag that enables you to select the connection factory based on the JMS destination (topic/queue). |
|
|
Flag that enables you to specify if the Adapter participates in local or XA transaction. |
Table 28-35 JMS Adapter Service Definition Properties
| Property Name | Description |
|---|---|
|
|
The name of the queue or topic. |
|
|
A string expression (based on a subset of the SQL92 conditional expression) specifying the messages the Adapter is interested in. |
|
|
Name used to identify a durable subscription. |
|
|
Specifies the type of JMS message. |
Table 28-36 JMS Adapter Service Tuning Properties
| Property Name | Description |
|---|---|
|
|
Poller threads created when an endpoint is activated. |
|
|
Timeout value used for the synchronous receive call. |
|
|
The time that the Oracle JMS Adapter waits before trying to re-create a connection after a connection is lost. |
Table 28-37 JMS Adapter Reference Definition Properties
| Property Name | Description |
|---|---|
|
|
The name of the queue or topic. |
|
|
The message's lifetime (in milliseconds). |
|
|
The priority for the message. |
|
|
The type of JMS message. |
|
|
The delivery mode to use. |
Table 28-38 JMS Adapter Reference Tuning Properties
| Property Name | Description |
|---|---|
|
|
Timeout value used for the synchronous receive call. |
|
|
The time that the Oracle JMS Adapter waits before trying to re-create a connection after a connection is lost. |
Table 28-39 AQ Adapter Connection Factory Properties
| Property Name | Description |
|---|---|
|
|
Datasource name for xa transactions. |
|
|
Datasource name for local transactions. |
Table 28-40 AQ Adapter Service Definition Properties
| Property Name | Description |
|---|---|
|
|
The name of the AQ queue. |
|
|
The schema where the queue resides. |
|
|
Dequeue message for a given consumer. |
|
|
The field containing the business payload if the queue is an ADT queue. |
|
|
Ensures all non- payload attributes of ADT are available for processing. |
|
|
Dequeues messages that match the value specified. |
|
|
Expression to allow dequeue of message based on a specific condition. |
Table 28-41 AQ Adapter Service Tuning Properties
| Property Name | Description |
|---|---|
|
|
The interval after which the |
|
|
The number of poller threads that are created when an endpoint is activated. |
Table 28-42 AQ Adapter Reference Definition Properties
| Property Name | Description |
|---|---|
|
|
The name of the AQ queue. |
|
|
The schema where the queue resides. |
|
|
The field containing the business payload if the queue is an ADT queue. |
|
|
Ensures all non-payload attributes of ADT are available for processing. |
|
|
The consumer name or names that are the intended recipients for the messages enqueued by the Adapter. |
Table 28-43 Coherence Adapter Connection Factory Properties
| Property Name | Description |
|---|---|
|
|
Location of cache configuration file that defines the cache and extend client settings. |
|
|
Name of the cache service to be associated with the connection. |
Table 28-44 Coherence Adapter Reference Definition Properties
| Property Name | Description |
|---|---|
|
|
Identifies a particular Coherence cache. |
|
|
The operation to be carried out on the cache identified by |
|
|
Specifies the subset of cache to which the operation should be applied. |
|
|
Fully qualified class name that identifies the object stored to/retrieved from cache. |
|
|
Boolean that allows for only cache identifiers (keys) to be returned. |
|
|
Identifier for a cache entry. |
|
|
Identifies the Java type of the value to be used as the key. |
Table 28-45 Coherence Adapter Reference Tuning Properties
| Property Name | Description |
|---|---|
|
|
Rhe size of the payload that Adapter can process. |
Table 28-46 MSMQ Adapter Connection Factory Properties
| Property Name | Description |
|---|---|
|
|
The name of the MSMQ host. |
|
|
Windows domain name of the MSMQ host. |
|
|
Indicates if the connection factory will allow for native access or not. |
|
|
Indicates if the connection will participate in a transaction when sending and receiving a message. |
Table 28-47 MSMQ Adapter Service Definition Properties
| Property Name | Description |
|---|---|
|
|
The type of queue. |
|
|
The name of the MSMQ queue. |
|
|
The actual string that identifies a DistributionList or Public queue as represented in ActiveDirectory. |
|
|
Boolean that allows for Active Directory Path to be used to identify a public queue instead of queue name. |
|
|
Boolean that allows for Direct Format name to be used for public and private queues. |
|
|
Correlation identifier. |
Table 28-48 MSMQ Adapter Service Tuning Properties
| Property Name | Description |
|---|---|
|
|
The time (in milliseconds) that Message Queuing will wait for a message to arrive before starting. |
Table 28-49 MSMQ Adapter Another Poll-Cycle
| Property Name | Description |
|---|---|
|
|
Number of poller threads that will be initialized when endpoint activation occurs. |
Table 28-50 MSMQ Adapter Reference Definition Properties
| Property Name | Description |
|---|---|
|
|
Type of queue. |
|
|
Name of the MSMQ queue. |
|
|
The actual string that identifies a DistributionList or Public queue as represented in ActiveDirectory. |
|
|
Boolean that enables the Active Directory Path to be used to identify a public queue instead of queue name. |
|
|
Boolean that enables the Direct Format name to be used for public and private queues. |
|
|
Message priority. |
|
|
Time limit (in seconds) for the message to be retrieved from the target queue. |
|
|
Specifies |
Table 28-51 SAP Adapter Connection Factory Properties
| Property Name | Description |
|---|---|
|
|
Gateway host. |
|
|
Gateway service. |
|
|
Program ID of the server. |
|
|
Enable/disable RFC trace. |
|
|
Arbitrary parameters for RFC library. |
|
|
SNC name. |
|
|
SNC level of security. |
|
|
Path to the SNC library. |
|
|
Flags whether to connect in unicode mode. |
|
|
Maximum server startup delay time in seconds. |
|
|
Maximum server connection threads allowed. |
|
|
Enable/Disable DSR support. |
|
|
SAP client. |
|
|
Logon user. |
|
|
Logon user alias. |
|
|
Logon password. |
|
|
Logon language. |
|
|
SAP router string to use for a system protected by a firewall. |
|
|
SAP system number. |
|
|
SAP application server. |
|
|
SAP message server. |
|
|
Optional: SAP message server port to use instead of the default SAPMS SID. |
|
|
Gateway host. |
|
|
Gateway service. |
|
|
System ID of the SAP system. |
|
|
Group of SAP application servers. |
|
|
Program ID of external server program. |
|
|
Host of external server program. |
|
|
Type of remote host. |
|
|
Enable/disable RFC trace. |
|
|
Enable/disable CPIC trace. |
|
|
Start a SAP GUI and associate with the connection. |
|
|
Initial codepage in SAP notation. |
|
|
Get/Do not get a SSO ticket after logon. |
|
|
Use the specified SAP Cookie Version 2 as logon ticket. |
|
|
Use the specified X509 certificate as logon ticket. |
|
|
Enable/Disable logon check at open time. |
|
|
Secure network connection mode. |
|
|
SNC partner. |
|
|
SNC level of security. |
|
|
SNC name. Overrides default SNC partner. |
|
|
Path to library which provides SNC service |
|
|
Enable/disable DSR support. |
|
|
Maximum number of active connections that can be created for a destination simultaneously. |
|
|
Maximum number of idle connections kept open by the destination. A value of |
|
|
Time in ms after that the connections hold by the destination can be closed. |
|
|
Period in ms after that the destination checks the released connections for expiration. |
|
|
Maximum time in ms to wait for a connection, if the max allowed number of connections is allocated by the application. |
|
|
Specifies which destination should be used as repository, |
|
|
If repository destination is not set, and this property is set, it will be used as user for repository calls. This allows using a different user for repository lookups. |
|
|
The password for a repository user. Mandatory, if a repository user should be used. |
|
|
If SNC is used for this destination, it is possible to turn it off for repository connections, if this property is set to |
Table 28-52 SAP Adapter Service Definition Properties
| Property Name | Description |
|---|---|
|
|
SAP object type. |
|
|
Name of BAPI object. |
|
|
Name of RFC object. |
|
|
Name of IDOC object. |
|
|
Program ID registered at SAP. |
|
|
Auto SYSTAT01 acknowledgment IDOC. |
|
|
Encode IDOC in flat file format. |
|
|
Migration support for older SAP Adapter. |
Table 28-53 SAP Adapter Reference Definition Properties
| Property Name | Description |
|---|---|
|
|
SAP object type. |
|
|
Name of BAPI object. |
|
|
Name of RFC object. |
|
|
Name of IDOC object. |
|
|
Name of SAP inbound queue to send. |
|
|
Stateful or stateless interaction. |
|
|
Migration support for older SAP Adapter. |
Table 28-54 Oracle E-Business Suite Adapter Connection Factory Properties
| Property Name | Description |
|---|---|
|
|
Datasource name for XA transaction. |
|
|
Datasource name for local transactions. |
Table 28-55 Oracle E-Business Suite Adapter Service Definition Properties
| Property Name | Description |
|---|---|
|
|
Internal name of the EBS interface from Integration Repository. |
|
|
How to poll for records and what to do with them after they have been read so they are only processed once. |
|
|
A name generated from the root table name. |
|
|
The name of the AQ queue. |
|
|
The schema where the queue resides. |
|
|
Dequeue message for a given consumer. |
|
|
Dequeue messages that match the value specified. |
|
|
Expression to allow dequeue of message based on a specific condition. |
|
|
Custom schema for business events payload. |
Table 28-56 Oracle E-Business Suite Adapter Service Tuning Properties
| Property Name | Description |
|---|---|
|
|
How often to poll for new records. |
|
|
How many records to fetch at a time and process in a single transaction (not per polling interval). |
|
|
How many top-level records to bundle into a single XML document and hence a single process instance. |
|
|
How many threads concurrently poll for and process records. |
|
|
Interval after which the |
|
|
The number of poller threads that are created when an endpoint is activated. |
Table 28-57 Oracle E-Business Suite Adapter Reference Definition Properties
| Property Name | Description |
|---|---|
|
|
Internal name of the EBS interface from Integration Repository. |
|
|
The schema to which the stored procedure belongs. |
|
|
The package to which the stored procedure belongs. |
|
|
The name of the stored procedure being executed. |
|
|
The SQL to execute. |
|
|
A name generated from the root table name. |
|
|
The name of the EclipseLink query being executed. |
|
|
If |
|
|
Indicates merge, insert, update or delete. |
|
|
Enables EBS function security check. |
|
|
To retrieve error messages from |
|
|
The name of the EBS queue. |
|
|
The schema where the queue resides. |
|
|
Overload sequence from Integration Repository. |
|
|
Flexfield mapping configuration file name. |
Scheduling JCA Adapter Endpoint Activation and Deactivation using Oracle Enterprise Scheduler
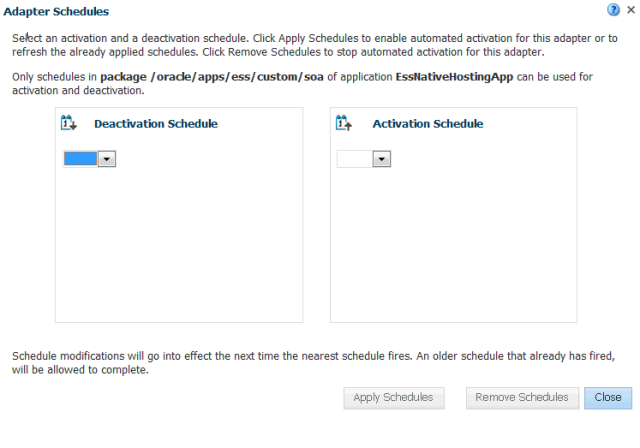
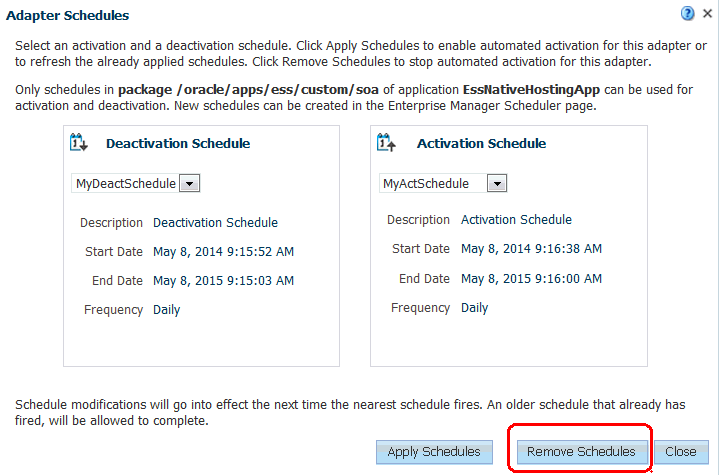
You can schedule activation and deactivation of the SOA composite JCA Adapter Services from Oracle Enterprise Manager Fusion Middleware Control.
Using Oracle Enterprise Scheduler schedule metadata you provide, you can:
-
Schedule a request for composite JCA Adapter service activation.
-
Schedule a request for composite JCA Adapter service deactivation.
Oracle Enterprise Manager Fusion Middleware Control also displays the current state of an Adapter endpoint (composite service), which can be either active or inactive.
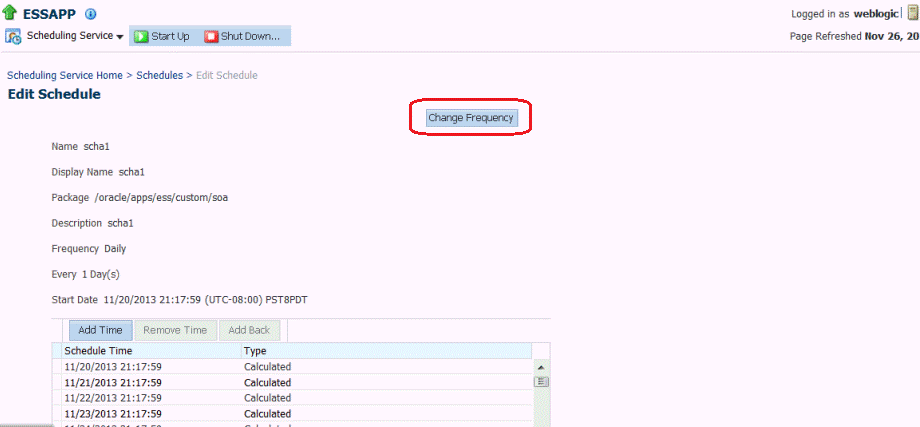
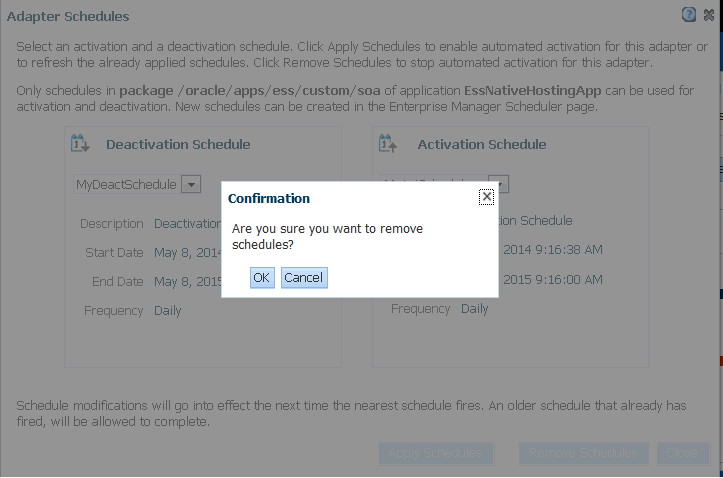
You can also edit existing metadata to alter your schedule, and you can remove schedules for Adapters.
Note:
Because the Oracle Enterprise Scheduler installation is optional, this feature is not be available if the Oracle Enterprise Scheduler is not installed.
Follow these steps to schedule activation and deactivation of the SOA composite JCA Adapter Services:
Create the Schedule Metadata
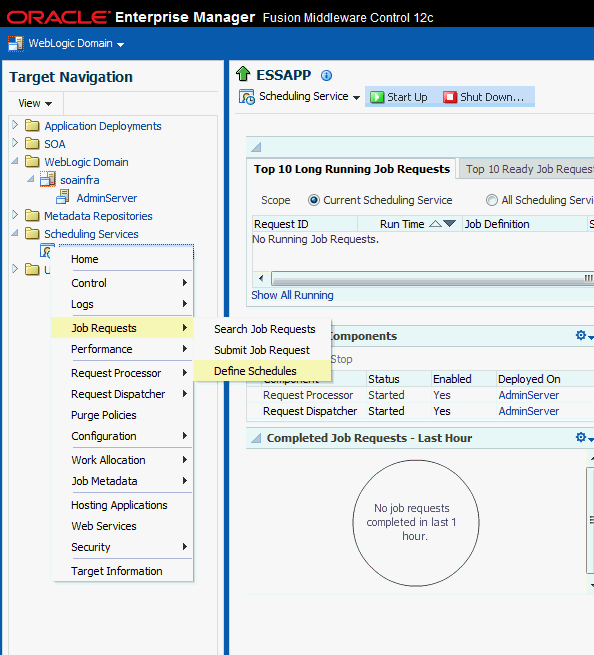
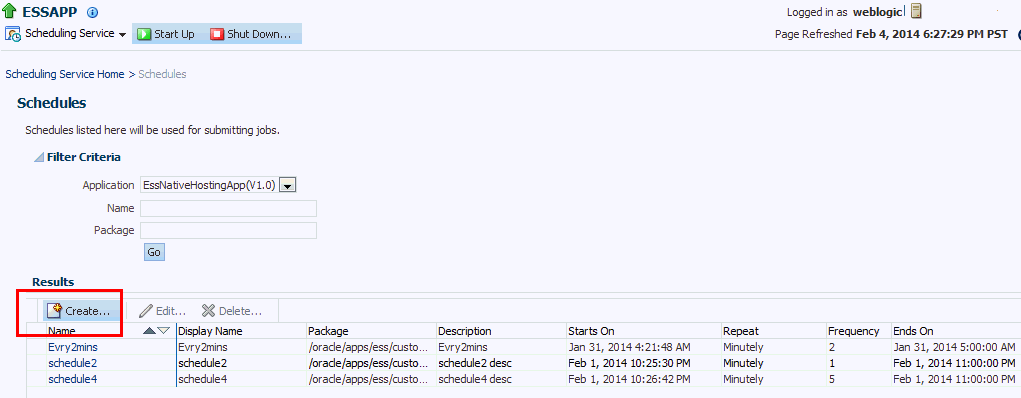
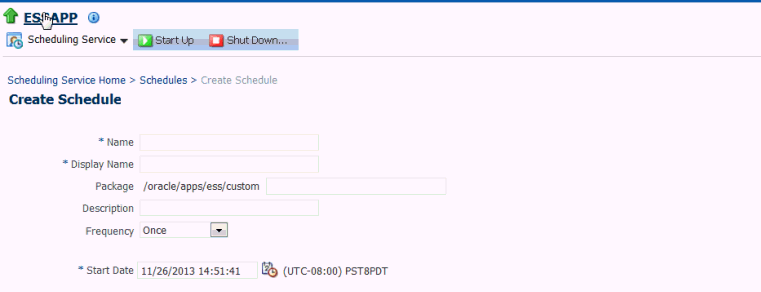
To create the schedule metadata, you fill in a form by selecting Define Schedules. The form populates the metadata.
Use the Created Schedule Metadata to Schedule the Deactivation and Activation of a SOA Composite JCA Adapter
You next use the metadata you have created to schedule the deactivation and activation of an Adapter.
Editing Oracle Enterprise Scheduler Schedule Metadata
You can edit existing metadata you have created using the Oracle Enterprise Scheduler/Oracle Enterprise Manager Fusion Middleware Control page. To do so:
Monitoring Adapter Resiliency
Resiliency deals with downstream service outages or connectivity issues that cause failures to build up within SOA. Within the context of JCA Technology Adapters, this means dealing with downstream service outages related to Adapters.
If a downstream endpoint is down or behaving sporadically, a large number of instances are forwarded to the error hospital and have to be recovered. If the endpoint is down, machine resources are wasted, as they partially process instances which are not going to complete anyway. The solution is to suspend upstream inbound adapters. With failure resiliency in place, messages wait in a queue or a topic until the endpoint is resumed.
To use resiliency, the first step is to enable it. You can enable it globally: each downstream endpoint inherits the failure resiliency configuration but you can override this resiliency for that one endpoint.
Once the upstream endpoint is suspended, periodically, one or a few messages are let into the flow. If the downstream endpoint is detected as clear, the upstream endpoint automatically resumes.
The Resiliency feature determines when a downstream endpoint is down based on system errors based on error rate heuristics (that is, M failures in N minutes.)
It then disables/suspends upstream endpoints where messages originated and leaves incoming messages in the natives system rather than erring out in SOA (Adapters, WebServices)
EDN events are still queued up in the system but not read by the subscriber.
The Resiliency feature supports JMS, AQ, DB, File and FTP Adapters.
WebService requests will be rejected.
The Resiliency feature monitors downstream endpoints and determine when the endpoints come back up by periodically processing inbound requests and re-enabling upstream endpoints if there is success in enabling a message to go through.
Resiliency provides Fusion Middleware Control dashboard notification and history for disabled endpoints; re-enabled status of upstream endpoints and enables upstream endpoints to be resumed from Fusion Middleware Control.
For complete information, see the section on resiliency in this guide.
Adapter Properties for Resiliency
You can define adapter properties in Fusion Middleware Control (in Adapter properties screen) and by using JDeveloper, the WebService properties are set using MBeans in Fusion Middleware Control and the same way as Adapters in JDev (composite bindings). Note that EDN subscribers cannot override resiliency properties.
