Unit testing the rulebase is the process of interactively testing a discrete section of rules to ensure that every sub-section operates as it should. The debugger enables you to perform targeted testing of your rules by manually setting attributes and investigating custom goals.
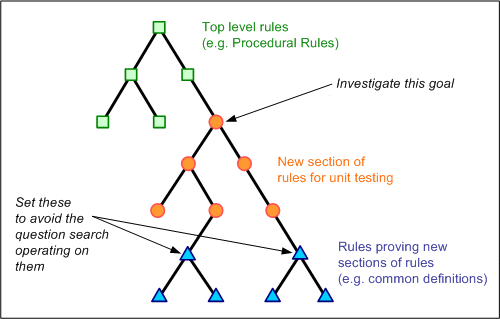
A section of the rules can be unit tested using the goal specific to just those rules without assessing other related or unrelated rules. This approach can be visualized in the following diagram:
In the diagram, the circles represent the attributes of the rulebase that are being tested. The top orange circle is the "custom" goal - that is, the goal chosen to be investigated for the purpose of unit testing. The squares represent the higher-level attributes that don't get tested because the goal investigated is not proved by them. The triangles represent attributes which have been "closed off" by setting them manually with the debugger.
To test a portion of the rulebase follow these steps:
Examine your rules and identify which branch of the rulebase you want to test. Identify the attribute which heads the branch to be assessed (the goal attribute).
Determine which attributes you need to set to close off the other branches of the rules. Using the debugger, set values for these attributes.
Check the validity of the conclusion. Change the rules if errors are identified.
Go back and change the answers until all of the sub-branches have been fully tested.
A similar process is used for unit testing smaller and larger branches of the rulebase. The smaller the branch the more detailed the assessment of all the different possible combinations of sub-branches.
Set the value for a base level attribute
To set the value of a base level attribute in the Decision view either:
Right-click and select from any of the following Set options in the menu: Set Value - this opens the Set Attribute Value dialog box where you can enter a value or set the value to 'uncertain' or 'unknown'. When setting variable values directly in the Decision view, values must be entered in the correct format: see Formatting of variable values for details. Set to True - this option is only available for boolean attributes Set to False - this option is only available for boolean attributes Set to <value> - this option is only available for variables. The values that appear here will be the values used in the rules or on screens. Set to Unknown - this option is used to clear the value of the attribute Set to Uncertain
Double-click the selected attribute to open the Set Attribute Value dialog box. Select or set the appropriate value, ensuring that it is entered in the correct format.
After setting a value, the list of attribute values in the Decision view (and the Data view) will be updated with the value you have specified.
In the Data view select the goal you want to investigate. It is handy to filter the attributes list by Top Level attributes (or by All to see the list of Inferrable attributes) to ensure you are selecting a non-base level attribute.
Right-click and select Investigate. This will open the Decision view with the attribute you have selected as the goal. The value of this attribute is unknown and all of the relevant paths to the goal are shown in the text box below. Entities for which no instances have been created yet will be shown just by the relationship text.
Work your way through the list of questions, setting answers (see above). In order to investigate any attributes which belong to an entity, you will need to add instances of that entity. Add your entity instances and continue investigating attributes until a value for the goal is known.
TIP: You can filter the list of relevant attributes using the checkboxes at the top of the Decision view. The Show rule checkbox displays the rule proving the selected attribute in the lower part of the Decision view - this can be useful to see which rule conditions are evaluating to what result to help understand how your rules are working.
Investigate an inferred relationship
After you have added any entity instances in the debugger, you can investigate an inferred relationship. To do this:
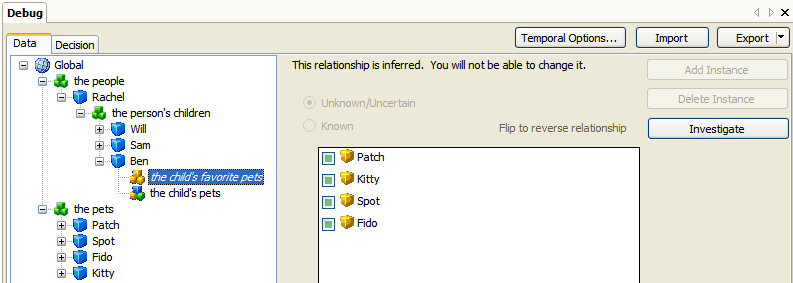
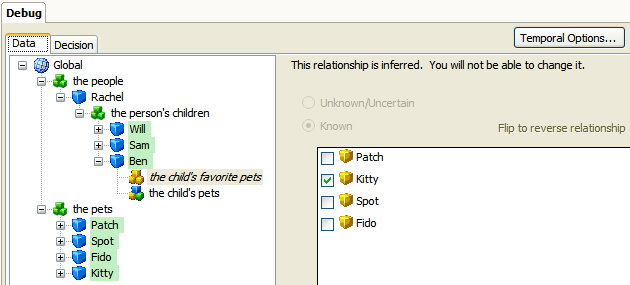
In the Data view select the inferred relationship that you want to investigate.
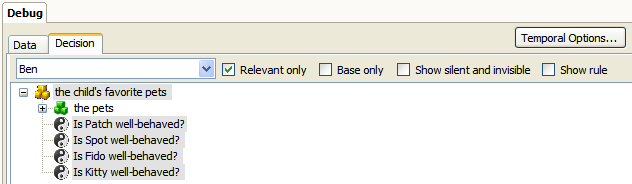
In the right hand pane, click the Investigate button. This will switch to the Decision view.
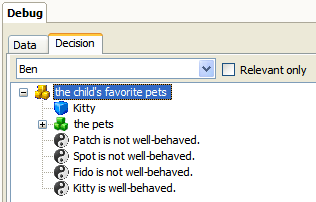
Set the values for any base level attributes. The Decision view will be updated as you go to show which entity instances have been inferred for this relationship, and the attributes contributing to this conclusion.
In the case of existing entity instances that have been inferred as members of a relationship (ie using IsMemberOf rules), these will be shown as selected items in the right hand pane of the Data view. (These entity instances will not be shown under the inferred relationship in the left hand pane as they have not inferred a containment relationship).
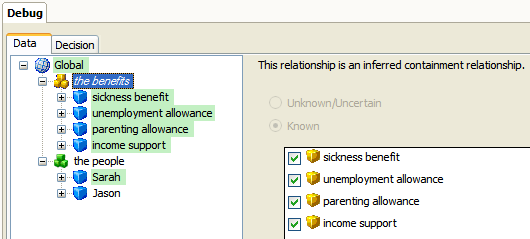
In the case of entity instances that have been created as members of a relationship (ie using InferInstance rules), these are also shown in the left hand pane of the Data view under the containment relationship that they have inferred.
Test data validations
The validation of data input (minimum values, maximum values, regular expressions, warnings and errors) can be tested using the debugger.
Test minimum and maximum values
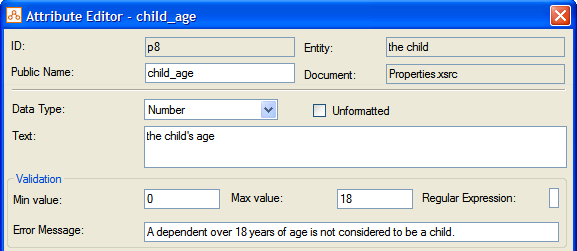
In the example below the data input (the child's age) has a maximum value of 18 specified in the Attribute Editor:
To check the functionality of this data validation:
Select Build | Build and Debug, and then select the Without screens option.
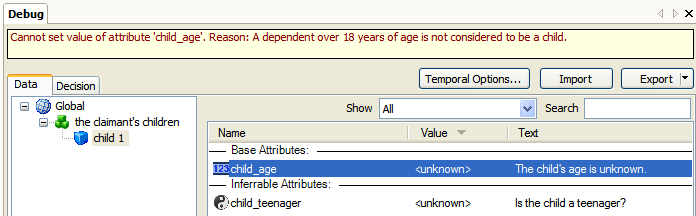
Right-click the attribute in the Data view and select Set Value:
Enter a value of 20 (ie outside the valid range of 0-18). Note that the configured error message will appear at the top of the Debug view:
The invalid value is not set. A value will not be set until you enter a value within the specified range.
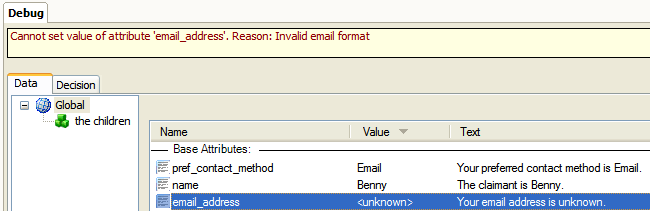
Test regular expressions
Similarly in the debugger, if you enter invalid data for a variable with a regular expression attached (ie data which does not comply with the format specified by the regular expression) you will be presented with the configured error message at the top of the Debug view:
As with validation by minimum value and maximum value, the invalid data is not set.
Test errors and warnings
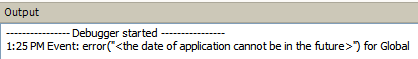
Unlike validation with minimum value, maximum value and regular expressions (see above), the invalid data which triggers errors and warnings will still be set in the debugger. The error message appears in the Output window in Oracle Policy Modeling, not in the Debug view.
In the screenshot below, the rules included an error event which triggered if the date of application is in the future.
TIP: If the Output window is not visible (eg because it has been closed or is being hidden by another window), you can view it by selecting View | Output Window from the main menu.