| Oracle® Pulse Getting Started Guide Release 17.1.2 E79199-05 |
|

 Previous |
 Next |
This section describes how to navigate Oracle Pulse. It explains how to move from the Pulse Dashboard through three levels of information - Customer Level, Service Level, and Environment Level - and how to use the user interface (UI) features common to all pages.
The following topics are covered in this chapter:
Oracle Pulse presents a comprehensive view of all your organization's Managed Cloud Services using the Customer, Service, and Environment levels. This section describes how to use these dashboards and the lists to navigate Oracle Pulse.
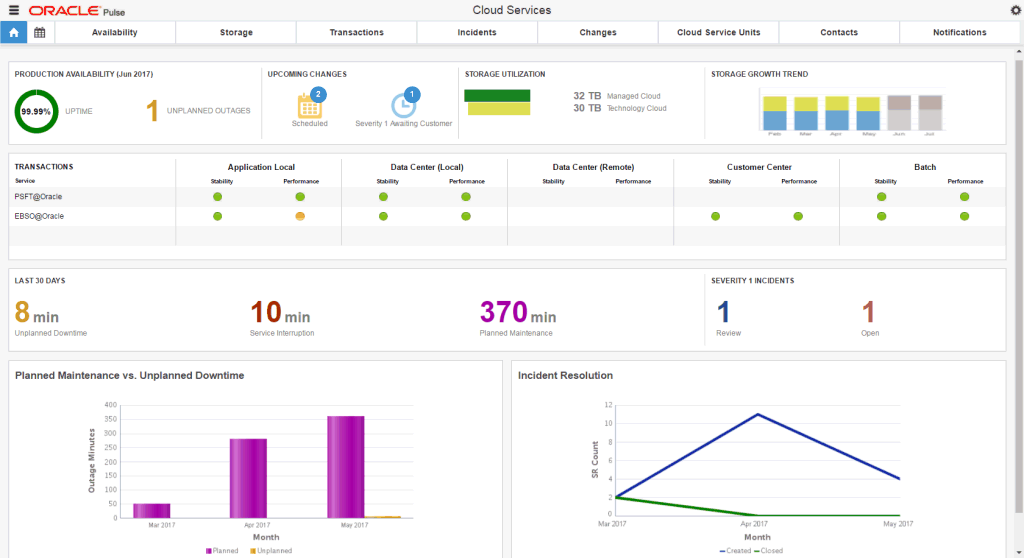
Pulse Dashboard - The Pulse Dashboard, which is the Oracle Pulse home page, analyzes the recent performance of all your organization's Managed Cloud Services. Click any metrics to see the table view.
(Web browsers only) To improve your Oracle Pulse experience on smaller screens, such as iPhones or other smartphones, the Pulse Dashboard widgets stack vertically.
Customer Level - The Customer Level shows the health of all your organization's Managed Cloud Services. Click any of the options on the navigation bar at Customer Level to see corresponding metrics for all your organization's Managed Cloud Services in that area:
Calendar
Availability
Storage
Transactions
Incidents
Changes
Cloud Service Units
Contacts
Notifications
Service Level - The Service Level presents key information for the selected service. Similar to the Customer and Environment Levels, the Service Level provides a range of navigation bar options that open a screen with metrics:
Availability
Storage
Transactions
Incidents
Changes
Environment records are listed in the lower part of the Overview Dashboard at Service Level. Click any environment record in the lower part of the screen to open the Environment Level page.
You can also switch to the Service Level page for another service - click the Menu icon ( ![]() ) in the upper left corner of the screen, then select the service you want to view.
) in the upper left corner of the screen, then select the service you want to view.
|
Note: If there are more than 3 services available for a customer, the side menu also contains a search field, allowing you to easily locate the desired service or environment. |
Environment Level - The Environment Level shows key performance indicators for the selected environment. Similar to the Customer and Service levels, the Environment Level provides a range of navigation bar options that open a screen with metrics:
Performance
Availability
Storage
Transactions
Incidents
Changes
Host and database records are listed in the lower part of the Overview Dashboard. Click any host record to see host metrics, or select any database record to see database metrics.
You can also switch to the Environment Level for another environment - click the Menu icon ( ![]() ) in the upper left corner of the screen, then select the environment you want to view.
) in the upper left corner of the screen, then select the environment you want to view.
|
Note: If there are more than 3 services available for a customer, the side menu also contains a search field, allowing you to easily locate the desired service or environment. |
Services and Environments Menu - The services and environments menu lists all your organization's services and associated environments. You can access this menu on any page at the Service or Environment levels using the Menu icon ( ![]() ) in the upper left corner of the screen. At Environment Level, the menu lists all the other environments for the associated service, while all services and corresponding environments are listed at Service Level.
) in the upper left corner of the screen. At Environment Level, the menu lists all the other environments for the associated service, while all services and corresponding environments are listed at Service Level.
This section describes the layout of the Oracle Pulse user interface (UI).
Pulse Dashboard Layout
The Customer, Service and Environment levels use key performance indicators, tables and charts to show the health of all your organization's Managed Cloud Services. Key performance indicators show data in both chart and table views, and are displayed side by side. Charts show graphical representations of data. Tables list all records, and are integrated among the widgets or shown in the lower part of the screen.
Double click any of the widgets to expand to full screen mode. Toggle between the chart view and table view using the symbols in the lower right corner of the widget. Click any record to open the lower level dashboard.
Where charts or tables are longer than the widget, click the widget to open expanded or full screen mode. Availability widgets also include horizontal and vertical scroll bars.
On Web browsers, the dashboard design also responds to the device size. Widgets stack vertically, and you can scroll up to see more widgets or the table of records.
Services and Environments Menu
You can access a list of all your organization's services and associated environments from any screen in Oracle Pulse using the Menu icon ( ![]() ) in the upper left corner. All services are listed with their associated environments. Select any service or environment to access the corresponding dashboard populated with the most recently collected metrics.
) in the upper left corner. All services are listed with their associated environments. Select any service or environment to access the corresponding dashboard populated with the most recently collected metrics.
Navigation Bars
Navigation bars at the top of each screen show options for the Pulse Dashboard and the Customer, Service, and Environment levels. Except for the Customer Level, all dashboards display the Overview Dashboard when opened. Navigation bar options respond to the width of the screen, with options tabbed vertically to the right:
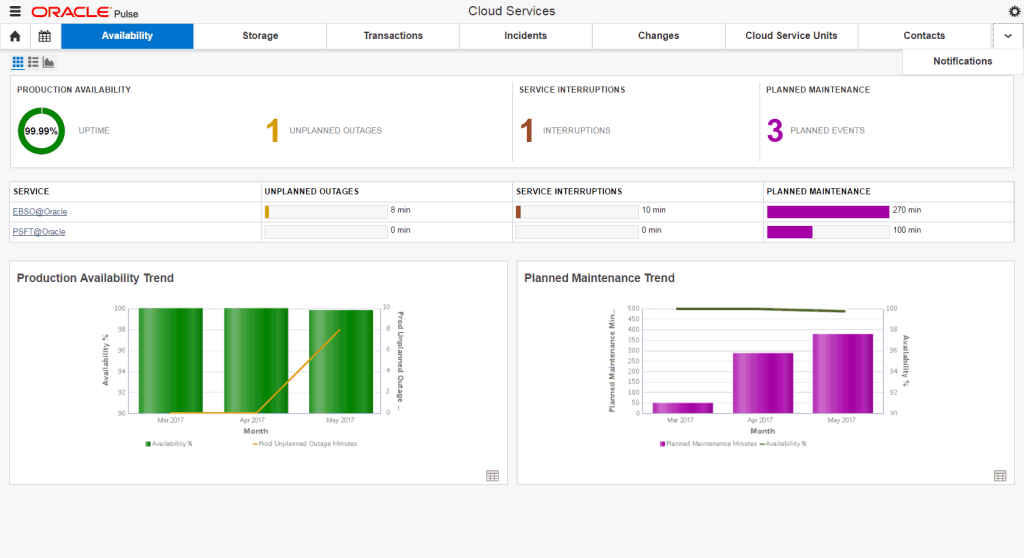
For example, use the navigation bar on the Customer Level, shown above, to move between the availability, storage, transaction, incident, and change.
The Customer Level navigation bar also has several options not available on the Service or Environment Level. The Calendar Dashboard provides a real-time report on the open and closed change requests and on the business events related to your organization's services, which are scheduled for the current month and for the previous and the next 12 months. The Contacts List displays records for all those involved in providing and managing your organization's Managed Cloud Services. Finally, the Notifications List shows all active and historical messages from Oracle about your organization's Managed Cloud Services.
By default, options on the right of the navigation bar are displayed in a vertical list. This improves the rendering of dashboards on smaller screens. Click the arrow at the right end of the navigation bar to show options in the vertical list and to return to the default navigation bar display.
Controls
The following table shows the controls with descriptions:
| Icon | Name | Description |
|---|---|---|
| Home | Click this icon to return to the Pulse Dashboard, which is the Oracle Pulse home page. | |
| Menu | Click this icon to open a list of all your organization's services and associated environments | |
 |
Back | Click this icon to return to the previous screen. |
| Settings | Click this icon to perform the following actions:
|
|
| Open Table View | Click this icon in any widget to flip to the data used to create the chart. |